Category: Interactive Map
-
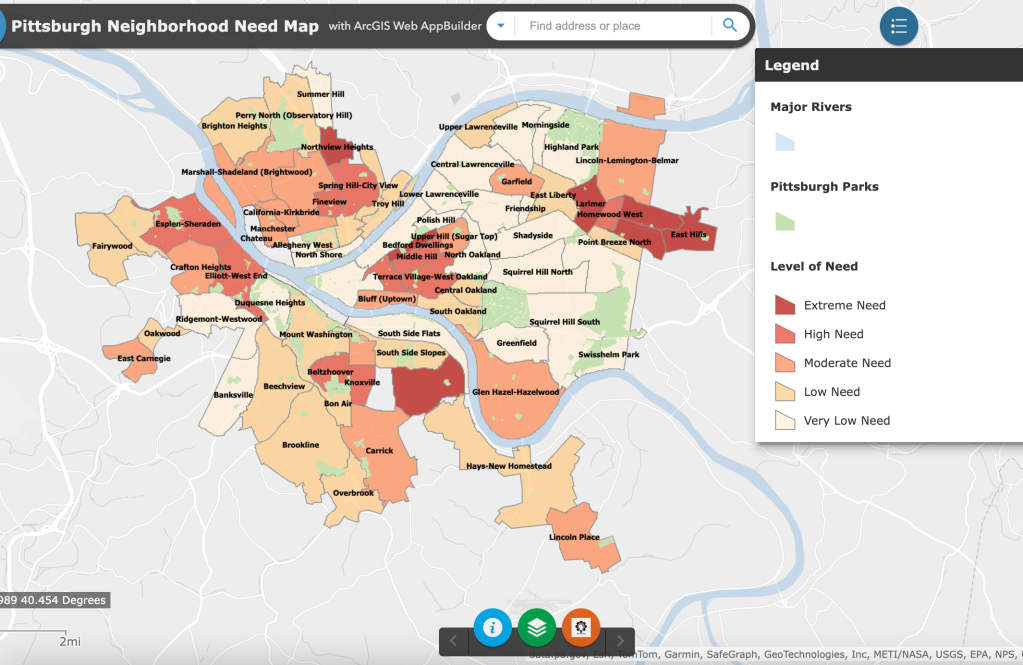
Pittsburgh Neighborhood Need Map
Welcome to The Pittsburgh Neighborhood Project’s Pittsburgh Neighborhood Need Map (PNNM), our updated follow up to the Pittsburgh Neighborhood Disadvantage Map. The…
-
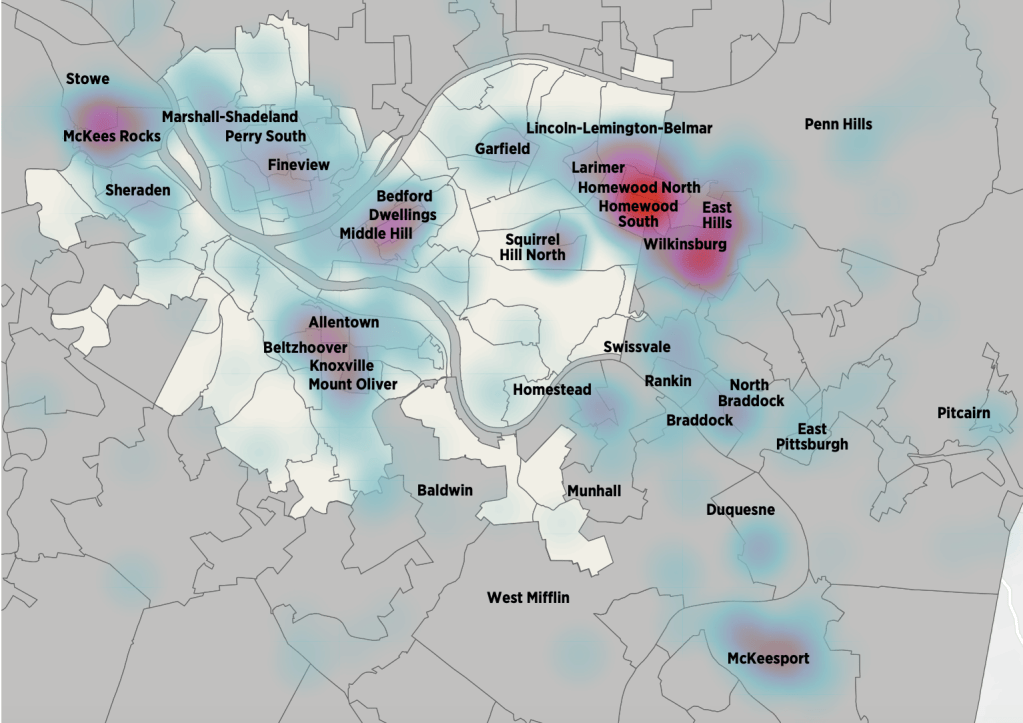
Geospatial Analysis of Gun Violence in Allegheny County, with focus on City of Pittsburgh
All people, regardless of race or socioeconomic status, deserve to live in neighborhoods that are safe and free of violence.…
-
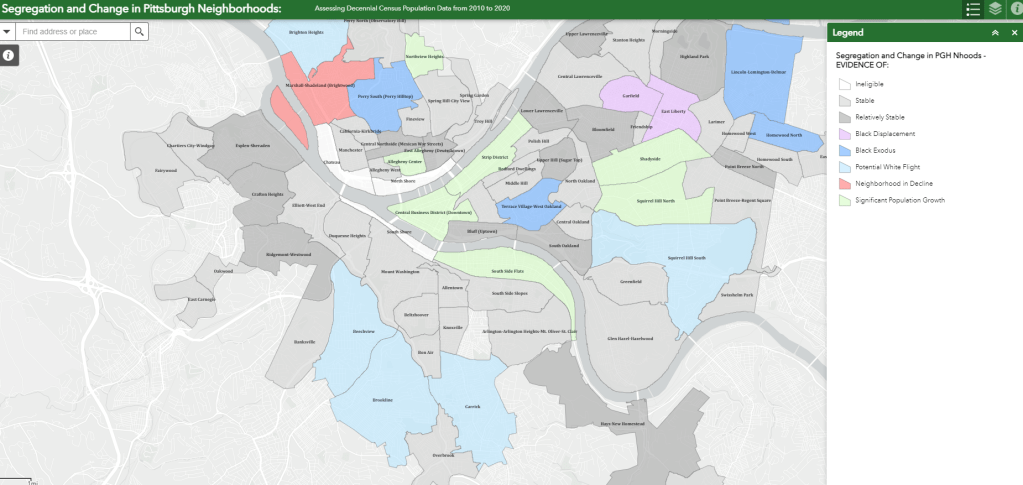
Segregation and Change in Pittsburgh Neighborhoods: Assessing Decennial Census Population Data from 2010 to 2020
The 2020 Decennial Census Data detailing population and housing totals is upon us. In light of this, we examined segregation…
-
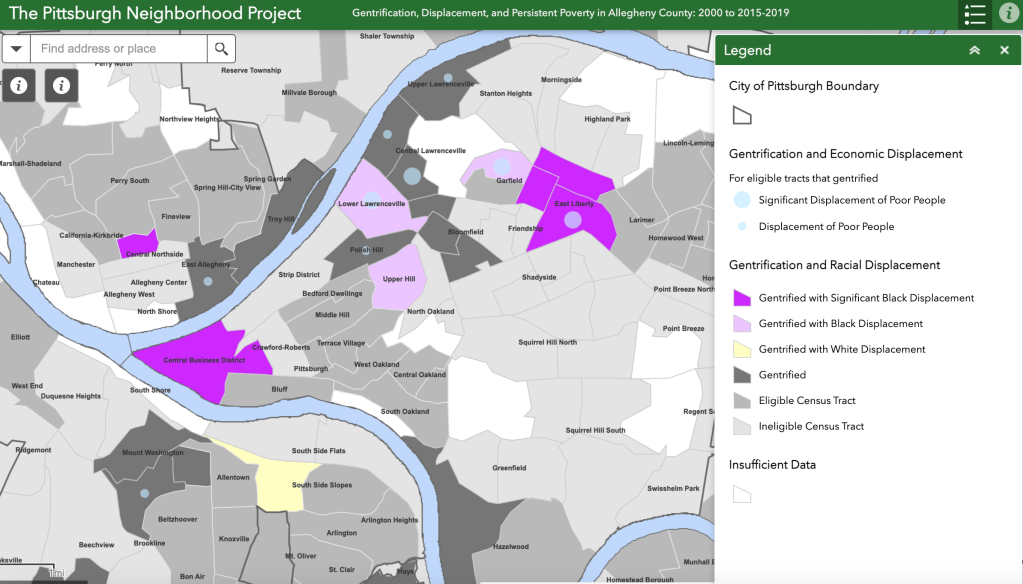
Gentrification and Displacement in Pittsburgh
The Pittsburgh Neighborhood Project has largely focused on the antecedents of persistent poverty and racial segregation/exclusion. For the following analysis…
-
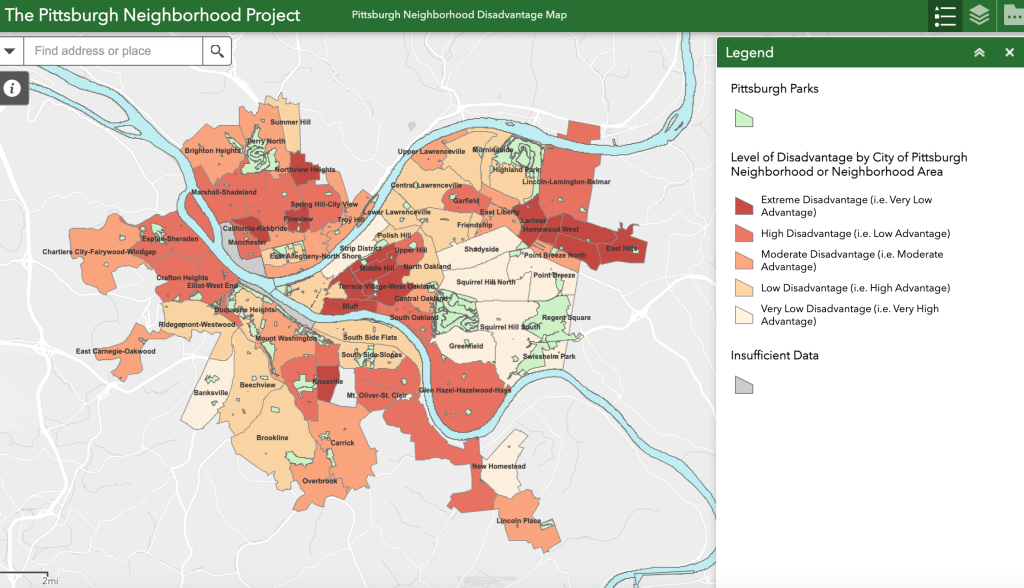
The Pittsburgh Neighborhood Disadvantage Map:
Welcome to The Pittsburgh Neighborhood Project’s Pittsburgh Neighborhood Disadvantage Map or PNDM. Place matters in determining a variety of long-term outcomes…
