Category: Neighborhood Profile
-
Neighborhood Profiles: Sheraden and Esplen
Up until the 2010 census Pittsburgh neighborhoods contained at least one or more census tract and those tracts roughly (or…
-

Neighborhood Profile: California-Kirkbride
Located just northeast of Manchester, California-Kirkbride is a majority Black and extreme poverty neighborhood that is bridged between the City’s…
-

Neighborhood Profile: Brookline
Brookline is the place that made me. It’s the place where my siblings and I learned to swim with the…
-
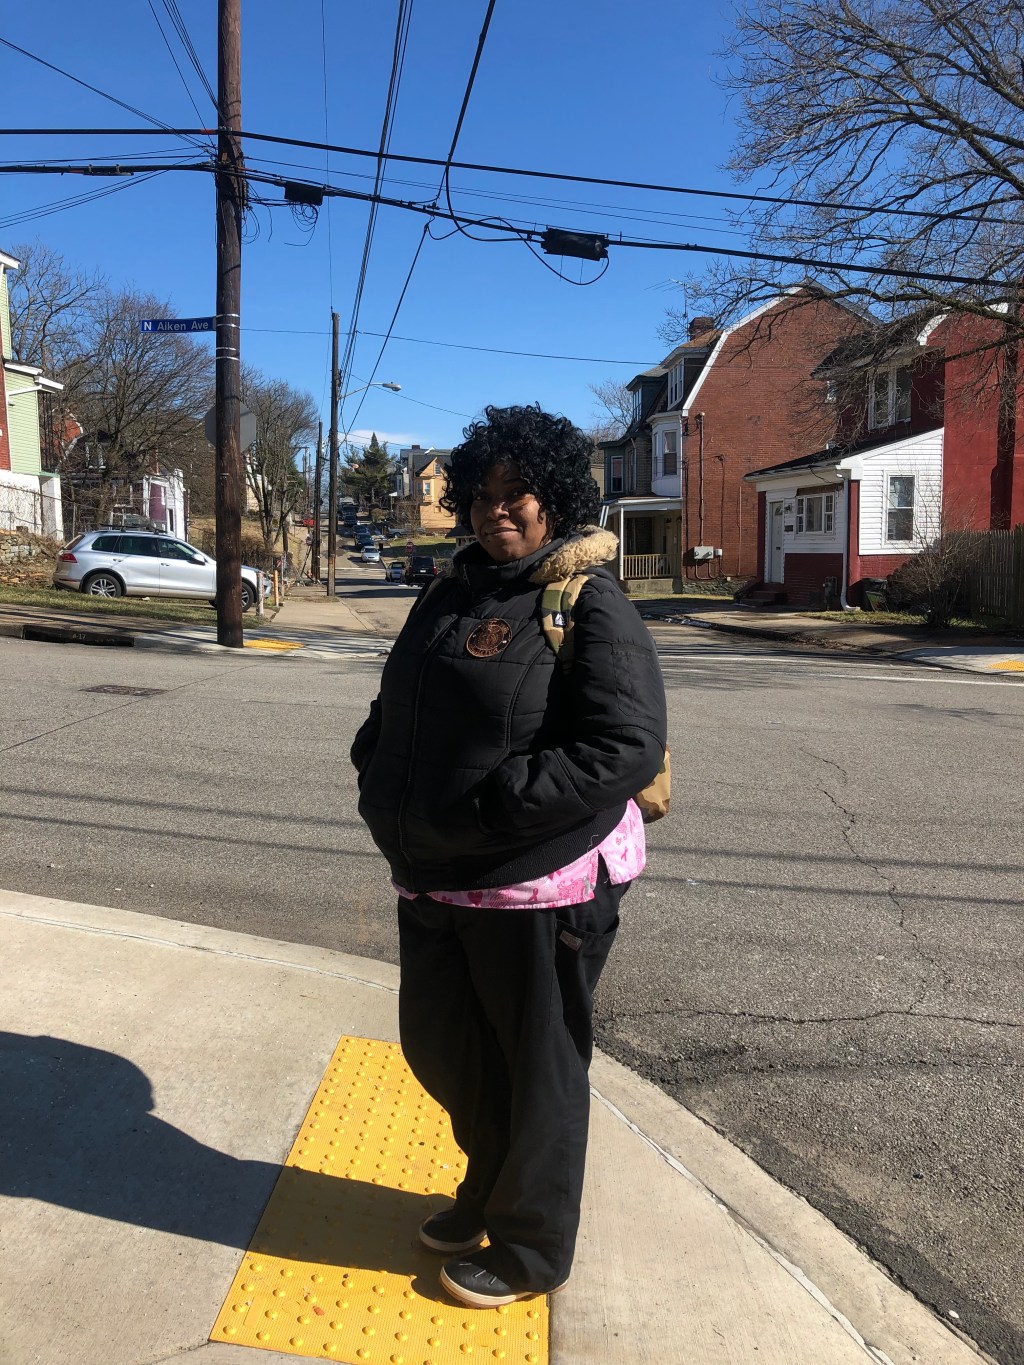
Resident Interview: Garfield
As many longtime Pittsburghers know, we learn to take advantage of days when the sky is actually blue and it…
-

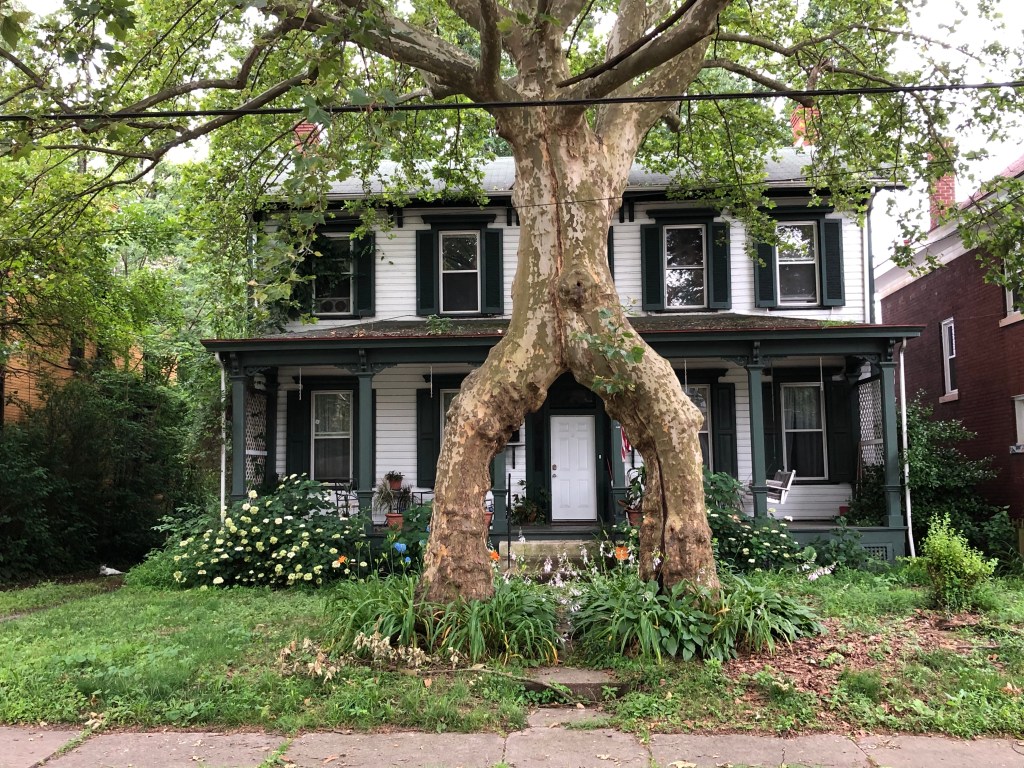
Neighborhood Profile: Garfield
I want to get this out-of-the-way now; I adore Garfield. My first ever rental home was on Broad Street in…
-

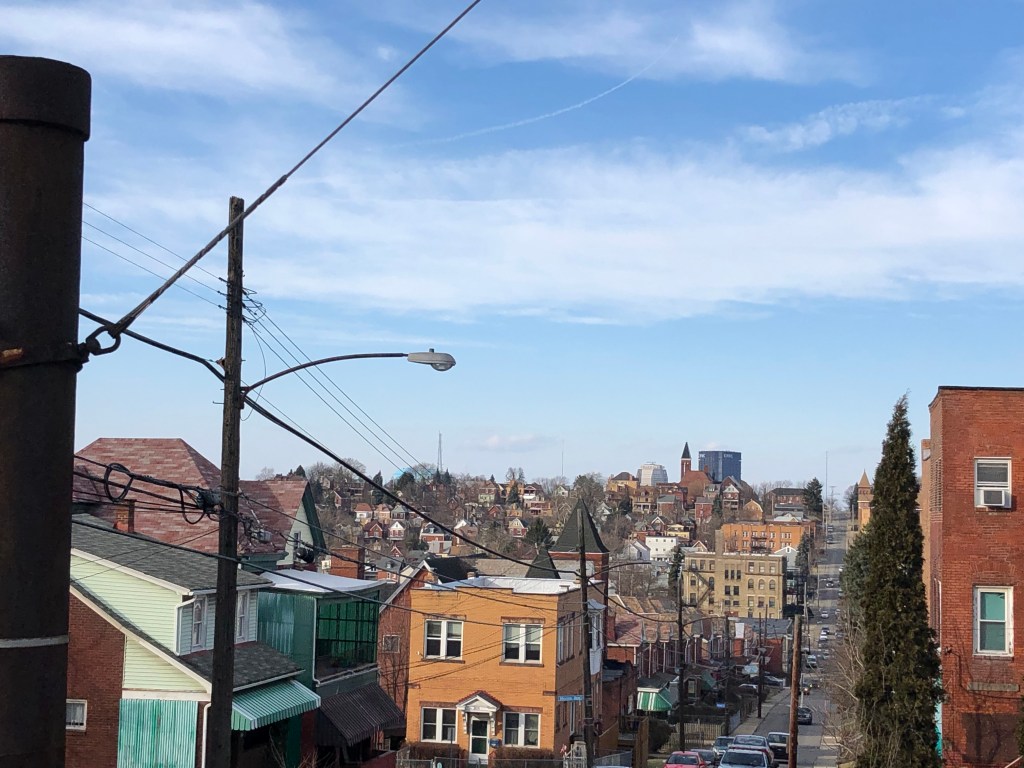
Resident Interview: Knoxville
It took me two separate trips to complete my street by street walk of the racially mixed and high poverty…
-
Neighborhood Profile: Knoxville
Once a thriving neighborhood home to middle managers of the Steel Mills that resided down below on the Monongahela river…
-

Neighborhood Profile: Manchester
The neighborhood of Manchester is located on the western portion of Pittsburgh’s lower Northside and is bordered to the south…
