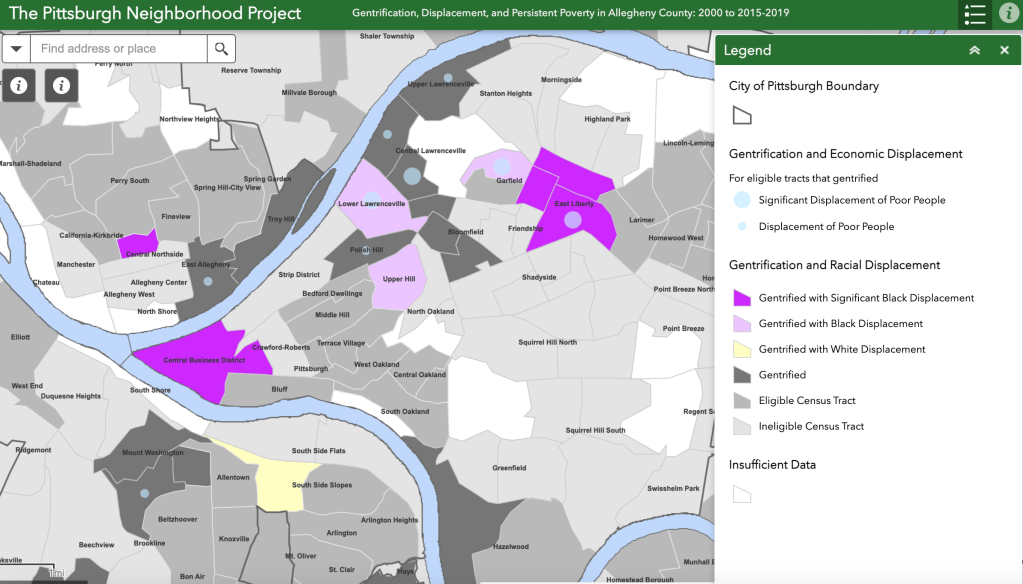
The Pittsburgh Neighborhood Project is a street by street exploration of the city’s 90 neighborhoods. As the beauty and uniqueness of each neighborhood is explored so too will the reality of lasting racial and economic segregation.
The Pittsburgh Neighborhood Project has largely focused on the antecedents of persistent poverty and racial segregation/exclusion. For the following analysis we focus instead on those places that have changed dramatically in Allegheny County over the past 20 years.
In fact, challenges related to gentrification and displacement are the other side of the coin regarding persistent poverty and segregation/exclusion. Our poorest communities are so because of intentional decisions at the federal, state and local levels that starved poor Black and Brown communities of investment, in addition to the effects of white flight, outmigration and deindustrialization. It is these same communities that are the most at-risk for gentrification and displacement, given their high concentration of vulnerable residents and the nature of more traditional forms of economic development. This is especially true of development that does not offer protections for existing residents who could be pushed out as the result of higher rents and increases in property taxes.
Gentrification is the movement of higher income, higher educated residents into what are historically lower income neighborhoods and is accompanied by rising home values.
The Pittsburgh Neighborhood project assessed whether lower income neighborhoods at the start of the 21st century stayed the same or significantly changed as of 2019 American Community Survey five-year estimates on measures of household income, home value and in the percentage of college educated residents. We also assessed whether gentrification is associated with significant changes in the racial/ethnic/income demographics of neighborhoods, for lower income tracts that did gentrify.
Overall, most census tracts that were considered low-income did not gentrify by 2019. However, several tracts in Pittsburgh’s East End and on Pittsburgh’s Northside gentrified and experienced considerable displacement, with poor Black residents being the most effected group.
Click here to read about major results of the study and to explore our interactive map on gentrification and displacement in Allegheny County census tracts from 2000 to 2015-2019.
The neighborhood of Manchester is located on the western portion of Pittsburgh’s lower Northside and is bordered to the south by Western Avenue, to the west by Chateau Street, to the East by Allegheny Avenue and to the North by the Norfolk Southern railroad. As of 2017 American Community Survey Estimates, Manchester had a population of 2,156 – up by 114 from 2012. The largely industrial and commercial neighborhood of Chateau lay to the west and south of Manchester while Marshall-Shadeland, California-Kirkbride, Allegheny West and Central Northside (better known as Mexican War Streets) are north, northeast, southeast and east of Manchester, respectively. Listed on the National Register of Historic Places in 1975, the neighborhood is home to the Manchester Historic District and is the largest historic preservation site in the City of Pittsburgh.
Manchester is located in Pittsburgh’s Northside region.
Historic Preservation plaques that describe architectural styles ranging from Victorian Eclectic to Second Empire dot houses throughout the neighborhood. And while the bulk of housing units are of the row home variety, mansions built when the neighborhood was still a part of Allegheny City – before its annexation by Pittsburgh in 1907 – reside on streets and avenues like Liverpool and W North. Crumbling and dilapidated houses litter the entire neighborhood, but their concentration appears to increase north of Liverpool Street and they comprise the majority of housing units towards the most northern tip of the neighborhood. But even in their decay, the houses are hauntingly beautiful and appear as resilient as the residents that were friendly enough to stop and talk to me on my street by street walk of their neighborhood. One Black woman was reserved and soft spoken, but told me that she was visiting her mother (who has lived in the neighborhood for most of her life). We spoke off Liverpool street. Her least favorite part of the neighborhood was the “issues with drugs,” but she loved the street festival that a local church puts on every summer.
Mansion located in the southwestern portion of Manchester.
Dilapidated building in northern section of Manchester.
The crumbling and graffitied former Manchester public swimming pool can be found in the most northeastern portion of the neighborhood in Manchester Park. And as a kid who once managed to get thousands of signatures in an attempt to stop the closure of so many of the city’s public pools in the early 2000s (to no avail), the sight of the old pool hit me hard with great waves of nostalgia and a longing for the days when my own closed pool at Brookline Memorial Park was still open. In Brookline the pool was repurposed into a turf hockey rink, but in Manchester it remains abandoned. A cement Dolphin still resides in the fenced off swimming pool and is a forgone image of a place that once gave joy to the Black bodied children of Manchester. And while the decay of the old swimming pool saddened me, there was so much to love about Manchester. Without a doubt, my favorite part of the neighborhood was a green through-way directly west of Manchester’s baseball field – which sits between the northern and southern sections of Fulton Street. From a lone picnic table beneath a well shaded tree, I could see part of Downtown’s Skyline and, with a turn of my head, I could look directly down Fulton and on towards the magnificent Original Church of God on Liverpool Street which was once a Roman Catholic Church; its steeple can be seen from various points throughout the neighborhood and acts as a sort of focal point.
Abandoned and graffitied Manchester Swimming Pool located in the most northeastern section of the neighborhood.
Green through-way located west of Manchester Ball Field – which sits between the northern and southern sections of Fulton Street. Steeple of Original Church of God in the distance.
While the neighborhood is almost entirely residential, several larger commercial businesses line Western Avenue and a few businesses and non-profits are concealed between homes in central areas of the neighborhood (including a graphic design company called Little Kelpie on Columbus Avenue, the Manchester Youth Development Center on Liverpool Street and the Northside Leadership Conference at Allegheny and Pennsylvania Avenues). The neighborhood is also home to a number of primary schools including Manchester Elementary, Manchester Prek-8, Manchester Academy Charter School and the historic building that houses the Conroy Education Center – along with several Christian Churches of various denominations. The neighborhood is flat, highly walkable and is easily accessible via several nearby port authority bus stops (with the 14 traveling along Manchester’s southern and western borders) and the Trolley’s Allegheny Station is a short walk down Allegheny Avenue from the southeastern tip of the neighborhood.
The Original Church of God on the Historic Liverpool Street.
As of the latest 2017 American Community Survey 5-Year Estimates, Manchester is a majority Black neighborhood (67% black) that went from high to moderate poverty from 1990 to 2012 (38% to 23%) and from moderate to low poverty from 2012 to 2017 (23% to 16%). In fact, Manchester has seen the second steepest decline in individuals living below the Federal Poverty Line from 1990 to 2017 among all Pittsburgh neighborhoods and neighborhoods areas – a decline in poverty of 22%. And regarding those neighborhoods with a simple racial majority (those with at least 51% of a population consisting of a given racial group), Manchester is one of only 3 majority Black neighborhoods that are considered lower poverty. Meaning, Manchester, the Upper Hill and East Liberty all have poverty rates between 10 and 19%. The other 14 majority Black neighborhoods are all high or extreme poverty – with the exception of Fineview on Pittsburgh’s Upper Northside which is considered moderate poverty. And besides the Upper Hill District, Manchester hosts the second highest median income for Black Households living in a majority Black neighborhood. Although, Manchester’s median household income for Black residents is still $26,000 less than the median household income for White residents (roughly $66,000 for White people and $40,000 for Black people).
And so, Manchester is unique for 3 reasons 1) Manchester is a majority Black neighborhood that isn’t high or extreme poverty – which is rare in Pittsburgh. 2) It has a Black household median income that is one of the highest for majority Black neighborhoods and is on the rise (roughly $32,000 in 2012 to $40,000 in 2017 or a 25 percent change increase). 3) And unlike most Pittsburgh neighborhoods that tend to remain durably low, moderate or high poverty over decades of time, Manchester is witnessing significant declines in poverty and other measures of disadvantage and is experiencing sizeable increases in housing value and income measures; and these changes are happening over a relatively short period of time. Durable concentrated poverty and the reality of residential segregation by race and income in Pittsburgh neighborhoods was the subject of a previous data brief.
Speaking to the 3rd point, and over a 5-year period from 2012 to 2017, the following measures of disadvantage have seen sizeable declines: individual poverty rate declined by 7.5%, poverty rate for Black residents declined by 6.3% (3 and half times the decline of White poverty over the same period), the rate of single mothers with children declined by 18%, the percentage of working age males declined by 25% and percentage of those 25 or older without a Bachelor’s degree or more declined by roughly 14%. As for median income, the median income rose from roughly $36,000 to $44,400 from 2012 to 2017. And as mentioned, Black household median income is on the rise – as is White household median income (up from roughly $51,000 in 2012 to $66,000 in 2017 or a percent change increase of 31%). Lastly, median gross rent and median home value have both seen sizeable increases – an increase of $111 for gross rent and a roughly $22,000 median home value increase (with an estimated median home value of $116,000 in 2017). Although, both median gross rent and median home value fell below citywide estimates for 2017.
Historic row home built in the architectural style of Queen Anne in 1889. Located in the central part of Manchester.
While Manchester has been a majority Black neighborhood for some time, it has seen a 10% decline in the Black population from 2012 to 2017 and a 12% increase in the White population over the same period (18% in 2012 to 30% in 2017). Given these declines in need and increases in median income, rent and household value, along with the fact that the poverty rate for Black and White households is not drastically different as of 2017 estimates (13.4% for Whites and 16.6% for Blacks), it appears as though low-income Black residents are leaving the neighborhood. This may possibly be due to involuntarily displacement which could be the result of sizeable increases in rent and home value (with rent increases negatively affecting those low or fixed income households who don’t own a home or home value increases affecting low or fixed income homeowners who can’t keep up with property tax increases). Or, perhaps, higher income Black people are moving into the neighborhood which is driving down the Black poverty rate – although steep declines in the rate of single mothers and other measures of need/population may contradict this thought somewhat. And so, the decline in Black poverty could be due to out-migration and not an influx of higher income Black people, after all. Further analysis of the households who are leaving and staying is required to claim that involuntary displacement is occurring, however. And even if it has yet to occur, recent demographic changes and the influx of higher income White residents suggest that involuntary displacement due to spikes in rent and home value may be inevitable without putting the proper protections in place now.
Because of the rising median income among Black residents and the value of Manchester’s Black median income as compared to other majority Black neighborhoods, higher-income Black residents in Manchester could stand to benefit from such improvements in their neighborhood regarding historic protections, renovation and development. And one thing is clear, Manchester is changing on several measures. Though-out my walk, I saw several teams of contractors doing renovations on buildings in the neighborhood. And so, perhaps its closeness to the sports stadiums of the Northshore, the art exhibits of the Mexican War Streets (and Allegheny Center), its walkability, and its large historic preservation site are factors that are causing a surge in median gross rent and median home value.
Tree lined streets lean away from historic row homes in Manchester.
On a final note, researcher Matthew Desmond, author of Evicted, has pointed to rising housing and utility costs, stagnant incomes and a decline in federal funding for affordable housing programs over the past few decades as the main contributors to the ongoing shortage of affordable housing (now known as the affordable housing crisis) and the City’s Affordable Housing Task Force reported that the city has a shortage of over 17,000 affordable housing units for households with incomes at or below 50% of Household Median Income as of 2016. As such, the affordable housing shortage affects high and low poverty neighborhoods alike. And Desmond has noted that eviction is common for low or fixed-income renters in high poverty neighborhoods that are not undergoing drastic change – especially so among Black single mother households. Meaning, growing eviction rates are not just a problem in the small number of Pittsburgh neighborhoods that are rapidly changing; they are also an issue in Pittsburgh’s poorest neighborhoods.
However, without tools to slow down rising utility and housing costs, an increase in income for low and fixed-income households and an expansion of affordable housing supply, neighborhoods that are changing at a faster pace than others may put low or fixed-income renters at even greater risk for involuntary displacement than those living in durably high poverty areas. While most Pittsburgh neighborhoods have not drastically changed over the past 27 years regarding poverty rate, as discussed in a previous data brief, Manchester is undergoing change, and this may be good news for higher income residents who can weather that change. But the neighborhood should begin to concern itself with the subject of affordable housing development and protection – as to allow low-income Black residents to remain in the beautiful, accessible and walkable neighborhood. And perhaps, neighborhood groups and affordable housing advocates are already having discussions about this topic.
Corner of Sheffield Street and Allegheny Avenue on the eastern border of Manchester. Pittsburgh Public Housing Authority apartments are just out of the frame and to the right.
Methodology Note:
All neighborhood level statistics were gathered via census tract level data from the 2012 and 2017 5-year American Community Survey estimates. Citywide statistics were gathered via the 2017 1-year ACS estimates. The 1990 poverty rate was gathered via poverty estimates from the National Historic Geographic Information Systems. The University of Pittsburgh Library System informed which census tracts comprised a given neighborhood on a given year. 2012 dollar amounts, incomes and values were adjusted for inflation using the consumer price index.
ACS estimates at the census tract level have sizeable margin of error and this may impact results.
Poverty intervals were informed by standards in neighborhood-level poverty research. Specifically, researcher Patrick Sharkey’s poverty intervals were referenced from his book Stuck in Place – regarding what constitutes an extreme, high, moderate, low or very low poverty neighborhood.