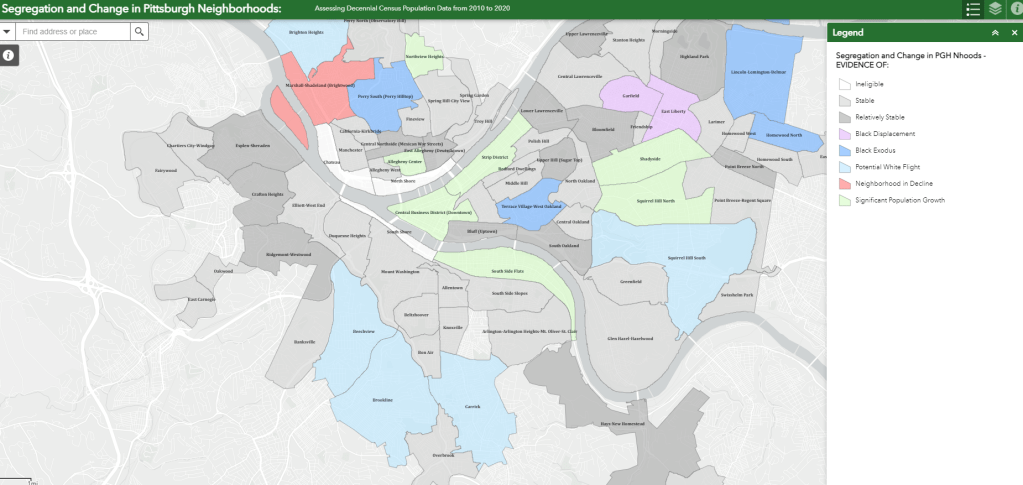
Segregation and Change in Pittsburgh Neighborhoods: Assessing Decennial Census Population Data from 2010 to 2020

The 2020 Decennial Census Data detailing population and housing totals is upon us. In light of this, we examined segregation and change in Pittsburgh neighborhoods from 2010 to 2020 (using P2 tables from the U.S Census Bureau).

We examined whether Pittsburgh neighborhoods tended to stay the same or change between 2010 and 2020 on measures of race, ethnicity and total population. Data was pulled for census block groups and aggregated to the neighborhood level using official City of Pittsburgh neighborhood boundaries. In some cases, multiple neighborhoods were grouped together because they shared the same block group boundary as of the 2020 census.

The results should be familiar to readers of our blog and neighborhood level research in general: most Pittsburgh neighborhoods did not experience a significant change in their racial and ethnic populations. Persistent racial segregation is still the rule, not exception. However, a number of neighborhoods did experience significant change.

By cross referencing former analyses of ours and comparing relative change across Pittsburgh neighborhoods, we examined whether there was evidence of Black Displacement, Black Exodus, White Flight, Neighborhoods in Decline, and Significant Population Growth, all of which are detailed in our findings and methodology.

While persistent racial segregation was the norm, neighborhoods like East Liberty saw evidence of Black Displacement, neighborhoods like Homewood North saw evidence of a Black Exodus for reasons unrelated to gentrification; neighborhoods like Carrick saw evidence of White Flight in response to growing diversity; neighborhoods like Marshall-Shadeland are emptying out and appear to be in decline; and Downtown and other wealthy neighborhoods saw Significant Population Growth.

Access our analysis writeup and interactive map with our primary findings by clicking here.

Urban Gun Violence in the City of Pittsburgh

Since February of last year I’ve completed a number of Neighborhood Profiles for some of Pittsburgh’s most disadvantaged neighborhoods. These profiles were informed by my street by street walk of each respective neighborhood, resident interviews, publicly available data and analyses I’ve completed for this project and by projects I’ve completed at the Allegheny County Department of Human Services.

As part of my resident interviews, I ask what residents like best and least about their respective neighborhoods. One of the most common refrains from the residents I spoke to was “Something has to be done about the gun violence.” As a result of these conversations, I decided to dedicate the past few months to writing the following essays on Urban Gun Violence in Pittsburgh; both to better understand just why our most disadvantaged neighborhoods suffer from comparatively high levels of gun violence and to see what the city is doing to address it.

These essays were informed by the Black residents I spoke to, prominent Black urban violence reduction practitioners, poverty, race and homicide/non-fatal shooting data (via the American Community Survey and Allegheny Analytics) and by national experts on neighborhood effects and urban gun violence.

These articles were published via Public Source. Please click on the links below to read them.

Urban Gun Violence Part 1 explores the community level antecedents of gun violence and shows that Pittsburgh’s Black communities are the primary victims of Urban Gun Violence. The essay makes clear that historic and current racism have led to these outcomes. The loss of life due to gun violence in our Black communities is astounding and tragic, and yet it does not receive the same public attention as other violence reduction efforts.

Urban Gun Violence Part 2 presents the most effective Urban Gun Violence reduction strategies. Several of these strategies require collaboration between law enforcement, community groups and social service agencies. However, the essay makes clear that aggressive policing and police violence against the Black community have eroded community trust in the police.

Black men stand at a frustrating crossroads because they are simultaneously the most likely to die from Urban Gun Violence and the most likely to be killed by the police. If Urban Gun Violence is to be effectively reduced, then the trust between the community and the police must be repaired, which will take considerable effort, policy changes and time. Black Lives Matter and this issue must be discussed with respect, data and urgency.


Neighborhood Profile: Brookline

Brookline is the place that made me. It’s the place where my siblings and I learned to swim with the patient help of my dad at the now closed Brookline Memorial pool. And the place where I once collected more than a thousand signatures to try to keep that pool open in the early 2000s. It’s the place where I was primarily raised. It’s the place where my mom once blew up an inflatable swimming pool with her breath alone because we were too poor to afford an air pump; it was an act of love and left her breathless. But it’s also the place where my siblings and I were abused – much like our parents were abused before they had us. And it’s the place where my siblings and I watched on in desperation as our younger brother endured two battles with cancer; one in his blood and one in his central nervous system. It’s the place where the first Las Palmas opened and is home to a growing Latino community. It houses Brookline’s commercial corridor which contained “moon-sized” pot holes for nearly all of my life, until it was re-paved a few years back. It’s home to Resurrection parish and the locally famous church carnival dubbed the Fun Flair. It’s the place where my siblings and I would play with our beloved dog Shadow in the backyard and where we cultivated bug gardens when we were too young to second guess picking up a spider. It’s the place where my best friend and I used to send each other to the hospital because of how dumb we were – which included an epic bike race down Brookline’s steepest cobblestone streets and a lot of stitches. It’s the place where I would wake up anxious during summer mornings when the sun had reached above my neighbor’s house; nervous that I had missed the chance to watch my feet illuminate with the sun’s glare as I sat on the stoop of our front porch on Rossmore Avenue.

IMG_1413
The house I was raised in on Rossmore Avenue in Brookline. Photo taken during the winter of 2019.

IMG_0930
Hockey Rink in Brookline Memorial Park. The rink replaced the swimming pool where I learned to swim as a child. My dad taught us all to swim. My mom would sit and watch near the Hippo that used to sit in the baby pool. Photo taken in the fall of 2018.

It’s the place where my neighborhood friends and I used to save up enough change so we could buy a pack of Pokémon cards at the former Fancy Nancy’s back in the 90s. And also the place where we played countless neighborhood wide games of basketball, release, had water balloon fights and screamed obscenities at each other while we played the Nintendo 64. It’s the place where we made horrible home movies with special effects including baby powder, the Titanic movie soundtrack and the machine gun noise from the N64 game Jet Force Gemini. It’s the place that houses one of our former rental homes on Fordham Avenue; the house where I was afraid to walk down the basement steps for fear that I would fall between the empty spaces. It’s the place where my first crush told me that, “Looks aren’t everything” and then kissed me on the cheek by the hoop out behind the house. It’s the main subject of my most recent band’s record literally called “Placed.” It’s the place where I learned to play guitar, learned to love and became resilient. It’s the place where I was once an altar server, Boy Scout, terrible baseball player and it was my escape for all those days I skipped school. It’s a place that some suburban kids with money (from my Catholic High School) associated with poor White people – even if I was one of only a small percentage of poor White families living in Brookline. They called me “White Trash.” I eventually gained enough confidence to call them “Yuppies.” It’s the place where my childhood best friend and I grew up; we were born in the same hospital 3 days a part and we’ve known each other for 30 years now. It’s the echo of nearly every cherished childhood memory I have. And it’s the place where I currently live. There are too many moments, places and people to speak of in Brookline. And while I may not remember all of them, they have shaped me.

IMG_0926
Brookline Boulevard is the neighborhood’s vibrant commercial district. The Brookline fire station is seen towards the center of the frame. Las Palmas is visible in the distance. Photo taken in the fall of 2018.

Brookline is accessible via the 39 and its northwestern border is accessible via the 41. However, bus service stops before midnight and the 39 doesn’t run at all on Sundays – which makes the neighborhood a bit inaccessible for people like myself who do not own a car and rely on public transit seven days a week. But much like neighboring Beechview, it is extremely convenient for those who work downtown, and commuters can make it to town via the South Busway in less than 15-20 minutes.  Like many of Pittsburgh’s hilly neighborhoods, Brookline streets are narrow and they often do not follow any sort of grid. As such, navigating them is a learned skill. Despite its many hills, the neighborhood is extremely walkable but has steep streets north, south, east and west of Brookline Boulevard. And city steps are a necessary form of transportation that allow residents to navigate Brookline’s various short cuts and its steepest streets. The border of Brookline is much like a Diamond. West Liberty Avenue comprises Brookline’s northwestern border and meets at a northern point with the neighborhood’s northeastern border – which is made up of the South Busway and Saw Mill Run Boulevard. Similarly, McNeilly Avenue, Dorchester Avenue and a number of other streets comprise the southwestern border and Brookline Memorial Park and several other streets come together to form Brookline’s southeastern and southern borders. Beechview and the suburbs of Dormont, Mount Lebanon and Baldwin Township border Brookline to the northwest, west, southwest and south, respectively. And Bon Air, Carrick and Overbrook border Brookline to the northeast, east and southeast, respectively. Saw Mill Run Boulevard cuts Brookline and other south Pittsburgh neighborhoods off from the neighborhoods located in the South Hilltop.

Brookline

Brookline is located in South Pittsburgh. 

Brookline is a durably low-poverty neighborhood that is primarily comprised of middle class and working class residents. Unlike other very low-poverty neighborhoods such as the affluent Squirrel Hill North, Point Breeze and Regent Square, which have the 3 highest median incomes in the city, Brookline is relatively affordable and has a considerably lower median income. And unlike durably high poverty neighborhoods like Knoxville and Garfield, Brookline has low levels of gun violence. Brookline offers a myriad of economically accessible and community driven enrichment activities for children and teenagers, has a vibrant commercial corridor with properties ranging from a local video game development incubator and arcade to the spacious Carnegie Library of Brookline and offers a number of local restaurants and a comic book store known as the Geekadrome – a place where teens can gather and play Magic the Gathering. Brookline is also home to the Pittsburgh famous Fiori’s Pizza and Pitaland, has two recreational parks and hosts a number of neighborhood youth sports’ teams. And as of 2015, it’s home to the Brookline Teen Outreach Center. BTO is a youth community outreach center that offers a variety of free programming, a safe space and activities for teens 10-18. My younger sister Joan has volunteered there since its inception and is one of the center’s therapists. BTO is a space that Joan and I wished we had access to when we were kids. And it’s one of the only programs like it in south Pittsburgh; the section of Pittsburgh that has one of the highest percentage of youth and yet has surprisingly little outreach regarding free counseling, tutoring, programming and connection to community service opportunities for teens. It is a welcomed addition to the neighborhood and needs support.

IMG_1409
The intersection of Flatbush Avenue and Bellaire Avenue. Brookline Boulevard is visible in the distance. Photo taken in the winter of 2019.

Like a number of Pittsburgh neighborhoods which are shaped by their respective topography, Brookline is contained and feels like a small town, not a dense City of Pittsburgh neighborhood. Named after its founders who hailed from Brookline, Massachusetts, the neighborhood was once a part of West Liberty borough and was annexed by the city in 1908. Brookline’s coal veins and rich land made the location ideal for farmers and miners. And it’s assets paved the way for a southern railroad and the construction of tunnels – in order to move goods to the city’s Monongahela river corridor. As a former trolley line and the construction of the Liberty Tunnel paved the way to Downtown Pittsburgh, the South Side Flats and the city’s East End, an influx of new residents drove dense residential development in the form of modest single family homes along the neighborhood’s peaks and valleys. Brookline is the second largest neighborhood in the entire city and has the 3rd largest population of all Pittsburgh neighborhoods and neighborhood areas (13,072 as of 2017 American Community Survey estimates and following behind Squirrel Hill South and Shadyside in total population, respectively). The neighborhood is home to Brookline Elementary and South Brook middle school. As of writing this, all of Brookline’s Catholic Schools are closed or closing – which include the former church of Resurrection’s school, Our Lady of Loretto and the former Brookline Regional Catholic – which was renamed as St. John Bosco Academy and is scheduled to close. My sisters and I attended all of these Catholic schools and received financial aid from the diocese of Pittsburgh, and my younger brother attended Our Lady of Loretto, the former Brookline Regional Catholic and Brookline Elementary.

IMG_1438
Sturdy brick single family homes off of Pioneer Avenue. Located across the street from Moore Park. Photo taken in the late winter of 2019.

Regarding my street by street walk of the neighborhood, I cheated this time. Through-out my over 30-years of life, I’ve lived in Brookline for more than 20 of those years. As such, I’ve walked every single street in Brookline many times over. The neighborhood has one of the highest elevations in the city and it’s always amusing when flurried snow falls only settle on the streets of Brookline and not in neighborhoods that are closer in elevation to the river beds. And given this elevation, the U.S Steel Tower and other downtown buildings are visible from the top of Rossmore Avenue and Flastbush –  in addition to other high up vantage points. While the neighborhood is comprised of a maze of tightly tangled streets and avenues, there is ample green space in Brookline. The untamed wooded valley east of Moore Park proper is the perfect place for paintball games – as evidenced by the many games I played there in my early 20s. And the would be forest surrounding either side of Edgebrook Avenue is vast and evokes an eerie feeling when driving down it after the sun has gone down. Likewise, a massive green space exists south of Whited Street and even more greenery is found via Brookline Memorial Park in the south-eastern part of the community.

IMG_1440
Intersection of Flatbush and Rossmore Avenues. The U.S Steel Tower is visible on the horizon. The northern section of Brookline is laid out below the steep hill. Photo taken in the late winter of 2019.

IMG_1812
Baseball field in Moore Park in Brookline. Moore Pool is in the distance. My brother and I are still swimmers and swim daily at the public pools and at the Oliver Bathhouse in the Southside Flats. This became our pool after Brookline Memorial pool closed down in the early 2000s. Photo taken in the summer of 2018.

Brookline is the space where my walks and my fascination with this city’s neighborhoods began. When I was younger, the streets of Brookline acted as a giant playground for my friends and me. And as a teenager and young adult, they offered an escape from my bouts of depression, panic disorder and loneliness. To this day, literally, my brother and I have walked Brookline in search of beauty, an ice cream cone from Scoops and to completely indulge ourselves in nostalgic conversations of our youth. Implicit in these statements regarding what Brookline is and what it has to offer is the idea that my growing up in Brookline offered me a form of stability that is not always found in Pittsburgh’s high poverty neighborhoods. And that growing up in a low-income home in such a connected, low violence and enriching community is not the same as growing up in a low-income home in areas of concentrated poverty; a reality that too many low-income Black children face. The majority of low-income White people in Pittsburgh live in neighborhoods with lower poverty rates as compared to those inhabited by the majority of low-income Black residents. As shown in the data brief regarding economic and racial segregation in Pittsburgh, nearly all of Pittsburgh’s majority Black neighborhoods are high or extreme poverty while only 3 of the 50 majority White neighborhoods and neighborhood areas are considered high poverty (i.e., neighborhoods with rates of 30 to 39% of individuals living below the Federal Poverty Line). There was no majority White neighborhood that was considered extreme poverty with rates of 40% poverty or more, while 41% of majority black neighborhoods were extreme poverty as of 2017 estimates.

IMG_0947
Resurrection Church off of Creedmoor Avenue in Brookline. A main stay of my walks through the neighborhood. I attended school here from kindergarten to first grade before it closed and was an altar server here. My Boy Scout Troop 6 of Brookline met in a room below the church. My dad loved the scouts. Photo taken in the fall of 2018. 

IMG_0950
My brother John looks on as the sun sets south of Chelton Avenue. This courtyard used to house the Church of Resurrection’s annual carnival called the Fun Flair. The last carnival was held here in the summer of 2016. It has since moved to St. Pius which is located off of Pioneer Avenue in the southwestern part of the neighborhood. My dad did the electrical work for this carnival since we were kids. My mother would walk us up when we were kids. Photo taken in the fall of 2018.

Brookline has remained very low poverty for at least the 27 years of data that I examined. From 1990 to 2017 the poverty rate remained below 10% (from 6% to only 9%). And the community is overwhelmingly White (91% in 2012 and 86% in 2017). In fact, with the exception of Squirrel Hill South, there are more White people in Brookline than any other neighborhood or neighborhood area in the city per 2017 ACS estimates. Luckily, the neighborhood has become at least marginally more diverse in the past 5-years. The percentage of Black people has grown from 4% to 6%, the Asian population from 1% to 3% and the Latino or Hispanic population from 1% to 2%. While this percentage of Hispanic or Latino residents appears to be quite low, Latinos or Hispanics make up only 3% of the entire City of Pittsburgh population per 1-year 2017 ACS estimates. And Brookline has the 3rd highest number of Hispanic or Latino residents when excluding college heavy neighborhoods (only Beechview and Greenfield have higher numbers). However, even marginal increases in the diversity of the community have been met by hostility and hate from a subset of the population. And while I owe much to this community, Brookline is not without its problems.

IMG_1398
“The Canon” veteran memorial at Brookline Boulevard and Queensboro Avenue. My siblings and I used to play on the canon when we were younger. Hell, I played on it last year. Photo taken in the winter of 2019.

In December of 2015 and March of 2016 the Mexican owned and operated Las Palmas on Brookline Boulevard was graffitied with hateful messages, which opened its doors to a growing Latino population in 2009 in Brookline. Phrases such as “Go Back to Mexico,” “Illegal Trespassers” and “Liars” were graffitied on the store. But luckily, and in a show of support against such bigotry, students from Brashear High School and other volunteers painted over the remarks and added their own mural and the phrase “Welcome to Brookline” in Spanish on the building. And a number of Brookliners lined the Boulevard to purchase food from the Las Palmas taco stand. In doing so, they showed that Brookline will in fact be defined as a neighborhood that welcomes minority groups, not one that detests them. But in November of 2018 yet another highly visible display of hate was tied to the neighborhood. Dozens of white supremacy and neo-nazi fliers were hung throughout the neighborhood just before the midterm elections. Phrases such as “Better Dead Than Red” and “Support Patriot Front” were written on the fliers. And this occurred only a week after the mass anti-Semitic shooting that left 11 dead in the Tree of Life synagogue in Squirrel Hill North. While the posters were torn down immediately and business owners and representatives denounced the messages of hate, these displays of hate are a reminder that there are those in Brookline that may welcome families like mine, but not ones that are different shades of hue or belief. Like Squirrel Hill North and many other overwhelmingly White Pittsburgh neighborhoods, Brookline is also highly segregated by race and income and its racial composition reveals just how separate so many Black and White Pittsburghers are from one another.

IMG_0955
Beautiful cobblestone road at the intersection of Rossmore and Glenarm Avenues. Photo taken in the fall of 2018.

Besides some growth in the non-White population, Brookline has changed little over the past 5 years according to ACS estimates. As of 2017 estimates, the percentage of single mothers with children was low at 9% (well below the citywide estimate), the rate of males unemployed or unattached to the labor force was below the city estimate at 21% and the neighborhood is becoming more educated with a 7% decline in those 25 and up without a Bachelor’s degree or more (75% to 68%). Regarding that last point, such a decline may be due to the more recent influx of educated families looking to work downtown and who wish to live in a contained and affordable neighborhood like Brookline. This influx may be represented in the growth of the median home value as well – which increased by nearly $7,000 from 2012 to 2017 (from roughly $91,000 to $98,000).

But besides some of the aforementioned changes in measures of need and value, most other indicators have barely budged. As of 2017, the median income stayed nearly unchanged at roughly $56,000 and median asking rent also barely changed and was roughly $850. The more noticeable changes are those regarding measures for Black individuals and families. While the White poverty rate barely decline over 5-years (roughly 9% to 8%), the Black poverty rate fell by 10 percentage points (32% to 22%) and the Black median income rose from roughly $46,000 to roughly $61,000. Clearly, and like in most Pittsburgh neighborhoods and neighborhood areas, there are racial disparities in the rate of those living below the FPL by racial group – with the Black poverty rate more than double the White poverty rate. However, Brookline is one of the few areas where the Black median income is higher than the white median income (roughly $61,000 to $57,000, respectively). Thus, it appears as though a small number of middle income Black households are calling Brookline home, given the large increase in median income and the sizeable decrease in Black poverty.

IMG_1802
My current rental in Brookline. Photo taken in the summer of 2018.

I am proud to call Brookline home. And I’m beyond lucky that my parents were able to move us to Brookline and raise my siblings and I here. While our home life was far from stable, and I can say that I still very much struggle with the long-terms effects of that instability and exposure to trauma, the stability of the broader neighborhood offered an important counter balance to the risk factors we experienced at home and else where. And it’s also more of what we weren’t exposed to that also helped us move ahead, regarding the comparatively high rates of concentrated disadvantage and community violence found in many of Pittsburgh’s poorest neighborhoods; a harsh reality born of concentrated poverty and extreme inopportunity that was explored in both the Knoxville and Garfield profiles. I firmly believe that my growing up in Brookline is connected to the social mobility that I’ve been lucky enough to achieve. And given that race has played such a large role regarding discrimination in our housing and lending markets and shaping the economic and racial compositions of neighborhoods across the U.S, my being White provided my parent’s with the ability to buy a house in Brookline – even though we were low-income. Our home life was extremely complicated, and my relationship with my parents is extremely complicated as a result, but I’m so grateful to have lived here.

IMG_1874
My dad in our back yard. There used to be a swing set back here. We spent a ton of time here as kids. Our pets are buried in back. RIP Shadow and all our other amazing pets. Photo taken in the summer of 2018.

IMG_1873
The initials “NBCJ” are painted in blue on our back deck off of Rossmore Avenue. It was painted on 8/8/2001. The initials stand for Nick, Bo, Conner and John. Bo and Conner were my childhood best friends and also lived in Brookline. John is my younger brother. I was surprised that the initials are still here nearly 2 decades later. Feels. Photo taken in the summer of 2018.

Although the 1968 Fair Housing Law barred discrimination based on race and other protected classes, the effects of segregation are often lasting and racial discrimination has been found on a large-scale as recent as the 2000s regarding subprime mortgage lending discrepancies based on race. Likewise, the law does not protect against source of income discrimination – which has been linked to landlord refusal of subsidized housing vouchers and can be used as a proxy for racial discrimination. And unlike some of my Black and Latino neighbors, I never felt unwelcome in Brookline. Lastly, neighborhoods like Brookline offer hope for low-income families who are able to move there. And neighborhoods do not need to be affluent to help provide low-income kids with the conditions and opportunities to get ahead; they can be working class and middle class areas like Brookline – with its very low poverty rate, low levels of community violence and connected informal and formal networks that can provide less fortunate neighbors with short-term and long-term living wage opportunities. A broad array of urban sociology and urban poverty research show that the neighborhoods in which we develop have profound and lasting impacts on our socio-economic and health-based outcomes. And researcher Raj Chetty of Harvard found that children below the age of 12 who were randomly assigned a subsidized housing voucher that restricted them to live in a low poverty neighborhood, via a housing voucher lottery, had significantly higher incomes as adults as compared to their peers who remained in high poverty neighborhoods. And so, if Brookline can be a welcoming place for low-income families with children of all colors and creeds, it may offer a pathway of social mobility for those families. Much like it did for me. Attitudes will not change over night, but as long as racial segregation (and a lack of dialogue about the benefits of diversity) continues to be the norm in many majority White Pittsburgh neighborhoods then these attitudes will likely persist. We must do what we can to welcome diversity in neighborhoods like Brookline, provide integrated and affordable housing options for low-income families, seek out and assist minority owned businesses and push to educate one another on the causes and consequences of racial and economic segregation in Pittsburgh.

IMG_0936
Brookline Memorial Park’s upper baseball field. I played baseball here for most of my youth. I was terrible. Guess what position I played? Hint: Most batters hit left or center because they are right-handed. I wasn’t good enough to catch their hits.

This neighborhood profile is dedicated to my siblings and my best friend Conner (all of whom I love deeply). And to Dillon and Cory whom are like brothers too and have learned to call Brookline their home over the years. And to my mom and dad who brought us here. I love you all. And I love Brookline.

Methodology Notes

All neighborhood level statistics were gathered via census tract level data from the 2012 to 2017 5-year American Community Survey estimates. Citywide statistics were gathered via the 2017 1-year ACS estimates. The 1990 poverty rate was gathered via poverty estimates from the National Historic Geographic Information Systems. The University of Pittsburgh Library System informed which census tracts comprised a given neighborhood in a given year. Because some neighborhoods share a census tract as of the 2010 census, several neighborhoods were combined and are known as neighborhood areas. There are 74 unique neighborhoods and neighborhood areas used in the analysis. 2012 dollar amounts, incomes and values were adjusted for inflation using the consumer price index. Because Brookline consists of 4 census tracts, neighborhood level estimates were calculated via a weighted average based on census to neighborhood population proportions.

ACS estimates at the census tract level have sizeable margin or error. This may impact results.

Snippets of broader Pittsburgh history were not cited because they are common knowledge. “Student heavy centers” include all those census tracts within known student heavy locations and those neighborhoods that contain a 4-year college or university.

In neighborhood profiles and data briefs, neighborhoods and neighborhood areas are considered to have a simple racial majority when a given race constitutes 51% of the total population. Otherwise, it is considered a mixed-race neighborhood.

Poverty intervals were informed by standards in neighborhood-level poverty research. Specifically, researcher Patrick Sharkey’s poverty intervals were referenced from his book Stuck in Place – regarding what constitutes an extreme, high, moderate, low or very low poverty neighborhood.

*The views expressed on this profile and blog are mine alone and do not necessarily represent those of my previous or current employers.*

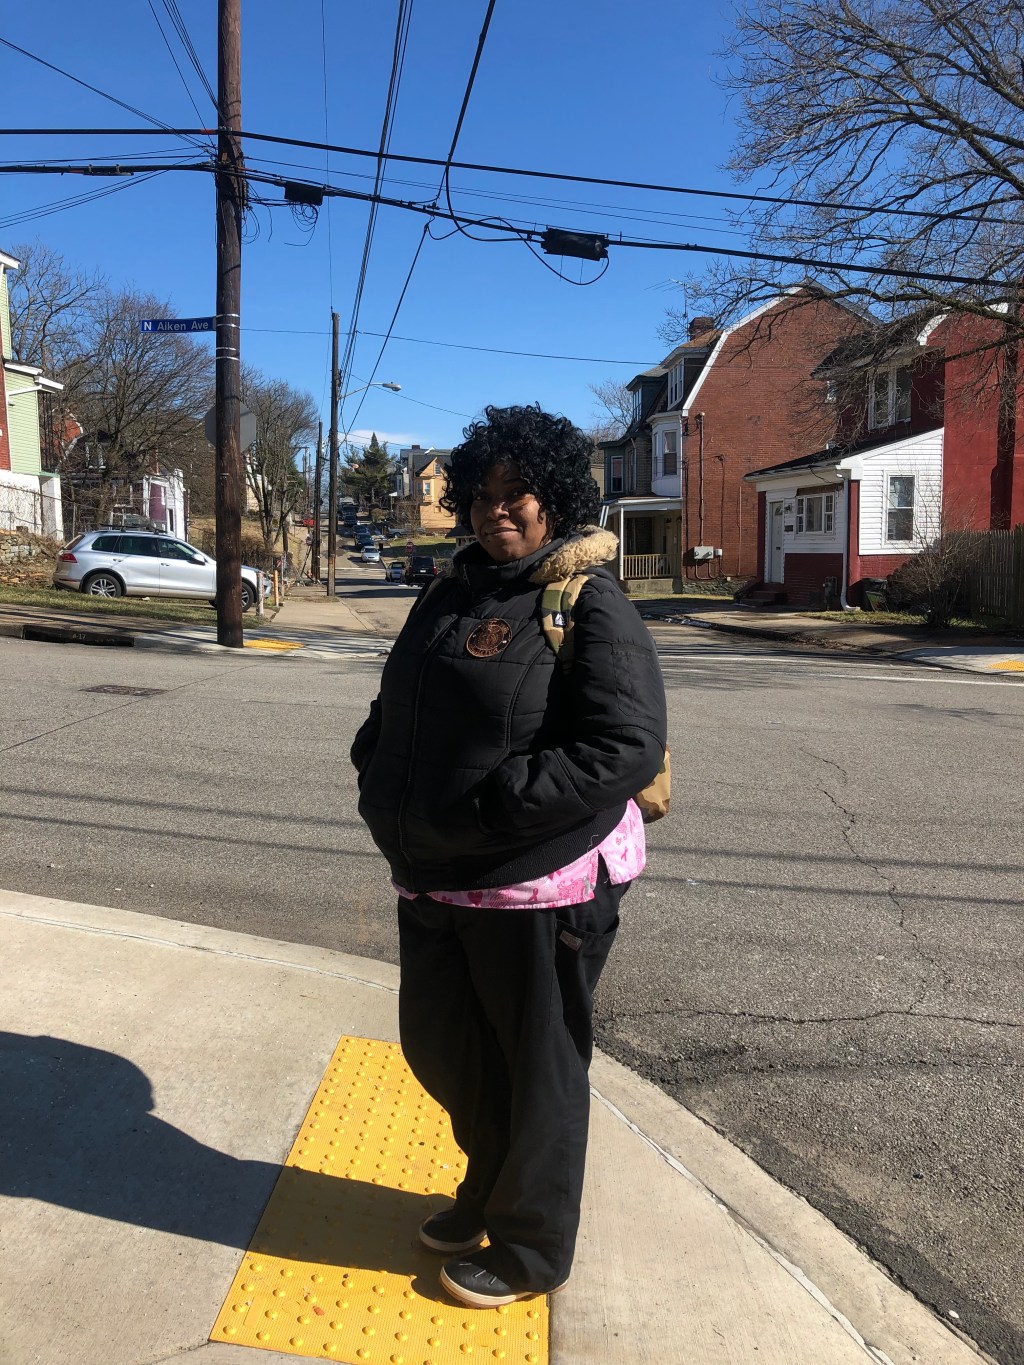
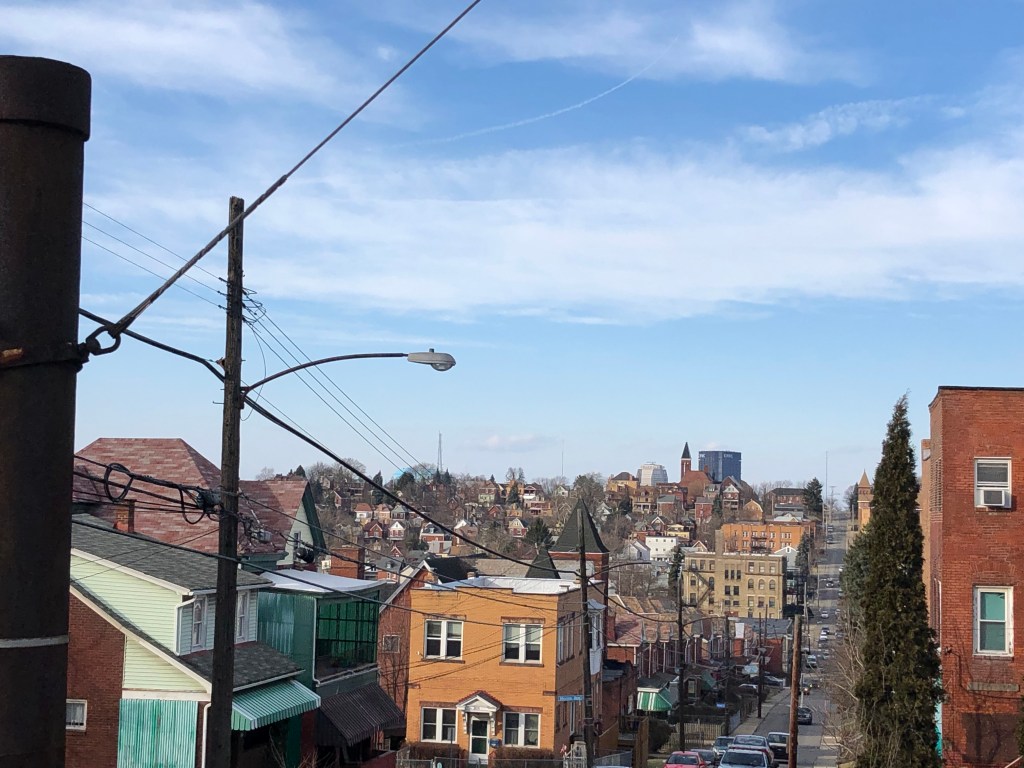
Resident Interview: Garfield

As many longtime Pittsburghers know, we learn to take advantage of days when the sky is actually blue and it isn’t raining. This is especially true during the winter when the constant dreariness and frigid temperatures can be somewhat oppressive. And so, I embarked on my street by street walk of Garfield on a beautiful and rare 50 degree day in mid-February. There wasn’t a cloud in the sky and walking up Garfield’s steeper slopes pushed me to remove my jacket on a number of occasions. The East End neighborhood is topographically and geographically diverse with streets that run west to east and hilly avenues that run south to north. And while sections of the northwestern part of Garfield are quite wooded, the remainder of the neighborhood is densely populated by solid brick single family homes and row homes  – with streets along the upper part of Garfield that give way to magnificent vistas of other neighborhoods that inhabit the East End down below.

About a quarter way through the grid like street patterns that comprise most of Garfield, I traversed a flight of city steps that connect Hillcrest and Rosetta Streets and made my way down N. Winebiddle until I came to Kinkaid Street. While heading eastward on Kinkaid, I ran into an approachable and soft-spoken Black woman named Alisha. She was waiting on the 89 at Kinkaid and N. Aiken and had a few moments to spare before her bus arrived.

IMG_1347
Alisha has spent 34 of her 37 years of life in Garfield and she loves her neighborhood.

Alisha has lived in Garfield for 34 of her 37 years on this earth. When asked about her favorite part of the neighborhood, Alisha stated, “Garfield feels more like a community than just a neighborhood.” When I asked her if she could elaborate, Alisha mentioned that the neighborhood has become more racially diverse in recent years. And she thinks this is a good thing. As also covered in the Garfield Neighborhood Profile, she went on to explain that the majority of White residents fled the neighborhood a few decades back, but that their return for her has been a welcomed one. Implicit in Alisha’s comments is a value placed on diversity and the benefits that such diversity can potentially bring to her and her neighborhood; and on an equally important note, the benefits that Alisha and her neighbors can bring to new comers. Alisha enjoys the fact that her neighborhood is becoming somewhat less segregated.  But when I pondered Alisha’s welcoming comments towards her new White neighbors, I wondered if Alisha would receive the same arms-wide-open welcome in Pittsburgh’s Whitest and equally segregated neighborhoods.

When I asked Alisha about her least favorite part of living in Garfield she said, “There used to be a lot of gang banging, but not so much these days. So there’s nothing I don’t like about Garfield.” For Alisha, the neighborhood feels safer these days and gang activity has decreased. She went on to say that gun violence has been a harsh reality for decades, but as people, investment and commercial activity have returned to her neighborhood so too has some peace of mind. Although Alisha’s comments are hopeful regarding a perceived decline in this type of violence, the neighborhood still suffers from comparatively high degrees of fatal and non fatal gun violence and shootings. From 2012-2017, and according to Public Source, there were 3 incidents of homicide by gun in 2012, 2 in 2013, 5 in 2014, 1 in 2015, 2 in 2016 and 3 in 2017 just from January to mid-august – with Garfield surpassing all other Pittsburgh neighborhoods in the first 6 months of 2017 alone regarding the total of murder by gun, shooting with injury and gun assault with no injury incidents. But as my friend James mentioned to me, perhaps Alisha’s part of the neighborhood has seen significant declines in violence; given that gun violence tends to be carried out by a small number of residents who create a disproportionate amount of that crime and because gun violence also tends to concentrate in micro-sections of high poverty areas like Garfield.

As detailed in the Garfield Neighborhood Profile and the Knoxville Neighborhood Profile, urban sociologists and scholars of urban poverty have found that economic circumstance, durable economic and racial segregation and prolonged in-opportunity, among other structural and systemic variables, are often high predictors of gun related crime in durably high poverty neighborhoods like Knoxville and Garfield.  Researcher Robert Sampson of Harvard found that concentrated poverty had an incredibly strong relationship with high homicide rates (R = 0.96, p <.01) in his book Chicago and the Enduring Neighborhood Effect and also found that high homicide rates in turn predicted higher rates of low birth rate. And despite deep declines in violence from the 1990s onward in American cities, high homicide rates remained concentrated and durable with declines far less steep in slope in neighborhoods of concentrated poverty (pp. 110-114). This is especially troublesome given research regarding the effect of gun related homicides on childhood cognitive development via standardized measures of IQ. Researcher Patrick Sharkey found that the IQ scores of children within 6 to 10 square blocks of a homicide saw their IQ score fall by 7 to 8 points in one study, if the murder happened within a week of their taking the test (and as compared to low poverty kids who didn’t have a murder in their neighborhood). Lastly, when compared to incidents of non-fatal gun violence in nearby Friendship, the difference between gun related violence and shootings in high poverty Garfield and low poverty friendship is one of kind, not degree – as can be seen in graphs below. Data was pulled from Allegheny County Analytics.

Garfield Guns

Friendship GunsRegarding a shout-out to a favorite institution, restaurant or the like, Alisha was at a loss for words. She said that that’s an area where the neighborhood is lacking and is in need of more diverse kinds of spaces and places where her kids can play. When I asked her specifically about her thoughts regarding the revitalized commercial corridor down on Penn Avenue Alisha said, “The art venues on Penn are interesting, but they don’t do much for me and my kids. My kids aren’t into that. And we don’t have the money to go to those new restaurants that are opening up. We can’t eat art.” For Alisha, while there is a diversity that new artists bring to the neighborhood, not all of the long-term residents of Garfield are into art, or the type of art showing up at the neighborhood’s art gallery crawls on the first Friday of every month. To illustrate the lack of structured space for her kids, Alisha motioned down Kinkaid Street and said that she had to go out and buy her children a basketball hoop so that they have a place to play.

IMG_1349
A basketball hoop off Kinkaid Street offers a space for kids to play, but a hoop in the street isn’t the same as a structured and fenced off basketball court.

IMG_1343
Artistic murals line brick walls in the neighborhood which in some cases may signal where artists and other new comers to the neighborhood live.

As recently described in the Garfield Neighborhood Profile, Garfield is a neighborhood that has seen significant investments in affordable, moderate and market rate housing development and rehab via The Bloomfield Garfield Corporation and the Garfield Jubilee Association. And it is also home to a number of community groups and youth development programs that aim to connect Garfield youth and young adults to education and in-demand workforce development services. But despite these efforts, the neighborhood suffers from comparatively high rates of extreme poverty, rate of single mothers, rate of males who are unemployed or unattached to the labor force and non-fatal and fatal gun related violence and shootings. As such, and like other durably high poverty neighborhoods in Pittsburgh, Garfield is a complicated place that is attempting to rise beyond the barriers that many of its Black and other long-term residents face. And as someone who lived in Garfield for 2 and half years, I also love this neighborhood, my old neighbors and the proximity that Garfield has to grocery stores, public transit and the rest of the East End. But generational poverty and gun related violence are not easily alleviated through local and well intended community programs alone. It will take additional citywide efforts that compliment what local neighborhood groups are already doing to raise the income of residents, connect long-term residents to living wage opportunities and ultimately address the factors that contribute to the neighborhoods fatal and non-fatal gun violence.

IMG_1363
The Open Door Church at the intersection of N. Pacific Avenue and Dearborn Street in the southern section of the neighborhood near the Penn Avenue commercial corridor.

The Pittsburgh Neighborhood Project is deeply appreciative of Alisha taking the time to talk with me while waiting for her bus in Garfield. Check out the full Garfield Neighborhood Profile here. The views expressed in this article and all other articles of the Pittsburgh Neighborhood Project are mine alone and may not represent those of my current or former employers.

*If this is your first experience with the Pittsburgh Neighborhood Project, the Pittsburgh Neighborhood Project is a street by street exploration of all 90 neighborhoods in the City of Pittsburgh. As each neighborhood is walked they receive a neighborhood profile detailing past and recent neighborhood level indicators and analysis, photos and observations from my walks and a brief history of the neighborhood. And resident interviews like this one complement their respective neighborhood profiles. The secondary goal of the project is to expose the high degree of racial and economic segregation by neighborhood in Pittsburgh and lasting neighborhood poverty. Data briefs address this secondary goal and are comprehensive statistical, geospatial and research driven analyses and extrapolations. You can check out my first data brief on racial and economic segregation in Pittsburgh and durable neighborhood poverty here. Please check out the Pittsburgh Neighborhood Project to see what I’ve analyzed and written about thus far.*

Neighborhood Profile: Garfield

I want to get this out-of-the-way now; I adore Garfield. My first ever rental home was on Broad Street in Garfield and I lived there with some of my best friends for roughly 2 and half years before moving back to Brookline. Our neighbors were overwhelmingly hospitable and sociable. Cook outs were abound (shout out to the time when our neighbor Jimmy liked my instant potatoes more than Cory’s methodically prepared steak). The neighborhood is close to just about everything in the East End via a high degree of walkability and a myriad of public transit options. Grocery stores are quite accessible and Garfield is home to a vibrant business district filled with wonderful Vietnamese, Indian and Black owned restaurants and businesses, the arts and First Fridays, and my favorite DIY (Do It Yourself) all ages music venue in Pittsburgh (aka the Mr. Roboto Project). Well, technically speaking, Roboto is in the most northern part of Bloomfield, but it’s literally across the street from Garfield. And I’ve had the pleasure of both playing and going to shows at Roboto for years. Garfield is filled with some of my favorite post-college and graduate school memories. As such, it’s hard to remove my positive bias towards the neighborhood itself, its institutions and my former neighbors. But like many other neighborhoods in the city, longtime residents of Garfield face steep challenges.

IMG_1358
I rented this house on the eastern side of Broad Street with some friends from the fall of 2014 to the summer of 2017.

The durably high poverty and overwhelmingly Black Garfield is situated in the northern section of Pittsburgh’s East End and residents on its southern and eastern borders have easy access to several major buses via the Penn Avenue and N. Negley corridors. The 88 rides along the southern border on Penn Avenue and the 77, 87s and the 71 A and C stop at Penn and N. Negley Avenue. And you can catch the 64 just a few blocks north of Garfield at the intersection of Stanton and N. Negley avenues (on the border between East Liberty and Highland Park). Much like East Liberty, Garfield is in prime port authority territory and residents can get to Downtown, the Lawrenceville neighborhoods, the Oakland Neighborhoods, the Strip District, Friendship, East Liberty, Bloomfield, Highland Park and a number of suburban boroughs and more with ease. However, the northern most part of the neighborhood grapples with extreme poverty, and residents there are much more isolated than those on the southern and eastern borders of Garfield – as will be discussed. Garfield is bordered to the west by N Mathilda Street and Mossfield Street, to the north by Mossfield Street and Black street, to the south by Penn Avenue and to the East by N. Negley Avenue. Allegheny Cemetery of Central Lawrenceville borders the neighborhood to the West and Bloomfield, Friendship, Stanton Heights and East liberty border the neighborhood to the southwest, southeast, north and east, respectively.

Garfield

Garfield is located in Pittsburgh’s East End region. 

At one time, Garfield was home to Irish immigrants who worked in the mills and foundries along the nearby Allegheny river corridor. And this concentration of working-class Irish Catholics remained in effect from the 1880s to the late 50s and early 60s. However, as was the case with a sizeable portion of Pittsburgh neighborhoods that will be profiled, suburbanization and White out-migration from the 1950s onward, de-industrialization from the late 1970s and 1980s and Urban Renewal in the 1950s and 60s heavily contributed to the depopulation and economic decline of the neighborhood and its transition from one that was once overwhelmingly White and working class to one that is now overwhelmingly Black. And a significant portion of the Black population lives below the Federal Poverty Line. In an attempt to lure suburbanites back into the City, the city’s Urban Redevelopment Authority used eminent domain to buy up houses, businesses and land to repurpose them for automobile focused development and suburban like amenities in nearby East Liberty – which once had the 3rd highest economic output for a business district in Pennsylvania. The plan massively back fired and led to further depopulation and economic depression. And when segregated, Black housing projects were erected in the Northern portion of Garfield and in East Liberty, White residents fled the neighborhoods in droves. Thus, it was racism against Black residents that delivered another blow to a Garfield of times past. The neighborhood was roughly 10,000 strong and 80% White in 1970. As of 2017 American Community Survey estimates, the neighborhood is 72% black and has a population of 3,846 – a roughly 60% decline in population.

The neighborhood may be high poverty, but its local community development corporations aim to revitalize the neighborhood while keeping it both affordable and mixed income through low-income, moderate and market rate housing rehab and development. The Bloomfield Garfield Corporation and Garfield Jubilee Association have been committed to affordable housing development in the neighborhood, and it shows. Additionally, the Bloomfield Garfield Corporation has a number of home rehab and development initiatives, business improvement programs and an income eligible rent to own program that is dubbed the Garfield Glen Project. The latter was funded via an awarding of Low-Income Housing Tax Credits from the Pennsylvania Housing Finance Agency and received additional gap funding from the Urban Redevelopment Authority. Redevelopment and blight reduction were evident throughout my street by street walk of the neighborhood. Unlike other high poverty neighborhoods, as with our Knoxville profile, Garfield does not appear to be plagued by high rates of neighborhood blight. There were examples of new and rehabbed housing everywhere. And with my own eyes, I saw at least 6 housing rehab crews at work on the beautiful 50 something degree day that I walked the neighborhood. A revitalized commercial corridor focused on the arts and mixed income housing development and rehab have played a significant role in making the neighborhood more desirable for longtime residents, artists and new renters and for home owners looking for a neighborhood that is affordable and close to just about everything and anything the East End has to offer.

IMG_1365
A small section of Garfield’s vibrant commercial corridor at N. Winebiddle and Penn Avenue. Spak Bros is featured in the center of the frame. The all ages Mr. Roboto Project music venue sits directly across from Spak on the other side of Penn Avenue.

I started my walk on the western portion of the neighborhood near Allegheny Cemetery and made my way north via N Mathilda Street and then Schenley Avenue. The latter part of my walk northward was covered by trees and felt like I was walking into the woods, and not a dense Pittsburgh neighborhood. The typography of Garfield is one of relatively flat streets running west to east in the western and central portions of the neighborhood and avenues that rise in slope as traveled from south to north. In the northern most part of the neighborhood is Garfield Commons, which is a mixed income community comprised of a significant number of public housing units owned by the Housing Authority of the City of Pittsburgh and affordable, moderate and market-rate units for residents not living in public housing. A 6000 feet community center is also available for resident use. Garfield Commons is large and stretches around Schenley Avenue, Columbo Street, Mossfield Street and more. The Water Tower Homes at Garfield Commons are situated off the most northern portion of N. Atlantic Avenue and give way to a beautiful look out where one can see much of the central East End down below and even downtown in the distance. The main issue is its disconnection from the rest of Garfield and the business district below. While residents of the commons have access to the 89 which runs as a looper bus between East Liberty and Garfield, the 89 runs less frequently than the 88 on the neighborhood’s southern border. But residents of the commons have easy access to the Garfield Community Farm off Columbo and Wicklow Street.

IMG_1304
There are northern parts of the neighborhood that feel as if you’ve entered a forest and not a dense neighborhood in the City of Pittsburgh. A cabin like house sits off a wooded Schenley Avenue.

IMG_1308
The public and mixed income housing project sits in the most northern part of Garfield.

IMG_1318
Atop a lookout at the Water Tower Homes at Garfield Commons which is located off the most northern stretch of N. Atlantic Avenue. Downtown and the now closed Fort Pitt elementary school are visible in the distance.

Hillcrest Street is situated in the northern and more traditionally residential part of the neighborhood. Modest brick and single-family homes run throughout the remainder of the neighborhood and larger homes with intricate architectural detail line the most eastern part of Garfield off of N. Fairmount Street. Hillcrest offers beautiful views of Garfield, Friendship and beyond – with the Cathedral of Learning in North Oakland nearly always visible in the distance while walking southward down Garfield’s sloping avenues. Hillcrest is also home to Most Wanted Fine Art, the Hillcrest Urban Farm and the now permanently closed Fort Pitt elementary school – which was listed on the National Register of Historic Places in 1986. The football field directly west of the school is home to the neighborhood’s youth football program the Garfield Gators and connects kids in the program with a structured activity and other mentor and afterschool-based programs in the neighborhood.

IMG_1323
Most Wanted Fine Art is just one example of the growing artist population that has come to call Garfield home over the years. The art space sits off of Hillcrest Street.

IMG_1328
Garfield and beyond as viewed via gaps between single family homes on Hillcrest Street. The Cathedral of Learning looms on the horizon.

The football field is also home to the annual turkey bowl between neighborhood residents on Thanksgiving. But much like Knoxville, gun violence has plagued the neighborhood over the past few decades. From 2012-2017, and according to Public Source, there were 3 incidents of homicide by gun in 2012, 2 in 2013, 5 in 2014, 1 in 2015, 2 in 2016 and 3 in 2017 just from January to mid-august – with Garfield surpassing all other Pittsburgh neighborhoods in the first 6 months of 2017 alone regarding the total of murder by gun, shooting with injury and gun assault with no injury incidents. As just one example of Black lives lost in the neighborhood, a father of five children and a caring husband named Sidney Barlow was tragically taken after trying to break up a dispute during a turkey bowl game way back in 1999.

IMG_1329
The now closed Fort Pitt elementary school. The field that the Garfield Gators plays in is directly west of the school. The annual Turkey Bowl is also played by neighborhood residents on the same field.

I lived in the neighborhood from the fall of 2014 to the summer of 2017 and never felt unsafe. However, we did hear bursts of gun shots and were well aware of the violence. Community violence has the tendency to be carried out by a small number of individuals who create a disproportionate amount of that crime. It also tends to concentrate in micro areas of a given neighborhood – with the northern part of Garfield tending to see the most heat. And because durable concentrated poverty, rate of single mothers and the male unemployment rate tend to play a large role in predicting violent crime, long-term residents of durably poor neighborhoods like Garfield are often the ones most exposed and subjected to that crime, not newcomers. A deeper look into the economic and structural causes of gun violence can be found in the Knoxville neighborhood profile. As mentioned in the profile, a number of urban sociologists state that gun violence tends to be a product of economic circumstance, high degrees of racial and economic segregation (and thus proximity) and prolonged in-opportunity (which is connected with drug trafficking or “Beefs” between those in various groups) and is not some moral flaw of residents in the neighborhood. A resident who I spoke to said that the gang related violence appears to be declining and mentioned that the neighborhood feels much safer more recently. Her words will be the feature of a future resident interview. However, with the exception of a dip in non-fatal shootings, gun related homicide and aggregated assault in 2015, gun related violence is still clearly and sadly an ongoing issue in the neighborhood. To highlight the divide in gun violence often found between high poverty and low poverty neighborhoods, incidents of non-fatal gun violence for Garfield and Friendship are visible in the graphs below. The graphs are vastly different despite the fact that the two neighborhoods are literally across the street from each other. For an additional divide, the median home value in Friendship is $261,400 and only $72,709 in Garfield – despite their close proximity to one another. And lastly, Garfield is a durably high poverty neighborhood while Friendship is low poverty. Data for the following graphs was gathered via Allegheny County Analytics.

Garfield Guns

Friendship GunsGarfield is a neighborhood that has seen significant degrees of affordable housing development, mixed income and market rate housing development, investment in the Penn Avenue business corridor and more, but is one that has seen little demographic change and income related change over the past few years and beyond. And as stated, the neighborhood has seen a significant amount of gun related violence. Regarding the area of Garfield that reportedly sees the most gun related violence, Garfield’s northern most census tract has the 9th highest poverty rate among all census tracts in the City of Pittsburgh (45%) and is 89% Black per 2017 ACS estimates – when excluding college student heavy census tracts from the poverty ranking. Additionally, the northern most census tract of the neighborhood has the 16th highest rate of single mothers (20%) and the 7th highest rate of males unemployed or unattached to the labor force (47%) – when excluding student heavy census tracts in the City of Pittsburgh. When looking at the entire neighborhood in the context of all neighborhoods and neighborhood areas in the city, Garfield is the 11th poorest (36%), has the 23rd highest rate of single mothers with children (14%) and the 13th highest rate of working age males who are unemployed or unattached to the labor force (34%).

IMG_1336
One of the many examples of work crews rehabbing homes in Garfield.

IMG_1296
A colorful assortment of row homes off of Dearborn Street on the southwestern edge of Garfield.

Regarding neighborhood change from 2012-2017, Garfield has changed on some measures but barely changed on others. Over a period of 27-years Garfield’s poverty rate declined by a mere 2% (38 to 36%) and the White and Black poverty rates have barely budged over the past 5-years. However, like found in our other neighborhood profiles, there is still a huge difference between the percent of Black versus White residents living below the FPL (40% to 23% according to 2017 ACS estimates, respectively). While the rate of working age men has declined over the past 5-years (40% to 34%), the rate of single mothers with children has seen a more significant decline (29% to 14% or a decline of 15%). The rate of those 25 and over without a bachelor’s degree or more also declined by 10% but still sits at a high 76% as of 2017 estimates. While there have been some declines in measures of need, they are still quite high compared to the rest of neighborhoods and neighborhood areas in the city and are consistent with measures of need in other high poverty areas. As a whole, median income has increased by nearly $10,000 (roughly $23,000 in 2012 to $33,000 in 2017). Median income stayed roughly the same for White residents ($37,000) and increased by roughly $7,600 for Black residents (from about $23,400 to $31,000). And there is still a difference of roughly $4,000 in median income between Black and White households. Lastly, measures of value have both increased and decreased in the neighborhood over the 5-year period. Median gross rent increased by about $135 ($699 to $834) and median home value decreased by about $600 ($73,300 to $72,700). Lastly, the neighborhood is overwhelmingly Black with a sizeable White population as of 2017 estimates (72% Black and 18% White). The small remainder of residents are biracial, Asian or Hispanic or Latino. And while White and Black demographics are changing (a 10% increase in the White Population and 11% decrease in the Black population), the neighborhood is still very much majority Black.

IMG_1350
Single family homes at Kinkaid and N. Graham Streets on the northeastern side of Garfield.

Unlike our Manchester profile wherein all measures of need had decreased by sizeable amounts over a short period of time and all measures of income and value had increased over that same period of time (and with Manchester also seeing the second steepest decline in poverty over 27-years), Garfield is much like our Knoxville profile in that some measures of need have stayed the same, some have changed, but all are still quite high comparatively. And while some measures of income and value have increased in Garfield, others have decreased. While an increase in median gross rent of roughly $135 dollars over 5-years may not sound like a lot, it can be sizeable for poor and working-class families and those households on a fixed-income, considering the reality of stagnating wages, rising housing and utility costs and a decrease in federal funds for affordable housing programs. But regarding those last two points, the Bloomfield Garfield Corporation and the Garfield Jubilee Association have built and rehabbed a large number of affordable homes in the neighborhood that are energy-efficient and their programs have allowed a number of a low-income renters to become homeowners through rent to own and income-based home ownership programs. These are necessary strategies that aim to protect the more vulnerable residents of Garfield as the neighborhood changes.

While affordable and mixed income housing development and commercial corridor revitalization play a role in blight reduction, deconcentrating poverty and protecting longtime residents from involuntary displacement (as neighborhood investments spur greater residential demand overtime), traditional brick and mortar community and economic development will not in and of themselves contribute to meaningful poverty and gun violence reduction. Garfield is a sobering reminder of this. The neighborhood is a truly charming area with breathtaking vistas, solid brick single family homes and a neighborhood social network that often feels tight and welcoming. I loved living in this neighborhood and I once planed on attempting to purchase my first home there someday. But many long-term Black residents live in extreme poverty and those in various subsections of the neighborhood are exposed to near constant gun related non-fatal shootings and to a comparatively sizeable number of fatal and non-fatal gun violence. Although affordable housing development is a necessarily step in stabilizing low-income renters and addressing the city’s affordable housing shortage, Pittsburgh can not simply build its way out of poverty and affordable housing shortages through affordable housing development alone. As mentioned, affordable housing development is a vital strategy to protect vulnerable residents from change and address the affordable housing shortage in this city. But it’s also one that can unintentionally reinforce concentrated poverty if it is primarily targeted to high poverty areas alone, and it is a strategy that may never meet the needed affordable housing demand. And as per research I do professionally, I can firmly say that the bulk of our affordable housing programs are highly segregated in areas of concentrated poverty and disadvantage.

IMG_1354
A spacious and intricate home on the eastern side of the neighborhood off of N. Fairmount Street.

While affordable and mixed income development can help stabilize lower-income residents, I believe that affordable housing development needs to be paired with city-wide efforts to raise the minimum wage, create and connect low-income residents to in-demand/high quality hard skill training programs that are financially accessible and place-based investments that focus on the people of neighborhoods, not just brick and mortar economic development/commercial corridor revitalization. As one resident I spoke to put it, “The art venues on Penn are interesting, but they don’t do much for me and my kids. My kids aren’t into that. And we don’t have the money to go to those new restaurants that are opening up. We can’t eat art.” You can read her full resident interview here. And lastly, perhaps the City’s shift to community policing will have a positive effect on neighborhoods like Garfield, but that remains to be seen. Because the causes of violent crime in high poverty neighborhoods are often related to economic circumstance and prolonged economic in-opportunity, raising the income of residents, connecting them with living wage opportunities and addressing the place-based factors that prime violent crime all must be pursued if the city is serious about significantly and positively impacting those living in extreme poverty; households who are exposed to the conditions that create the opportunity for community violence. And luckily, the Garfield Jubilee Association is hard at work doing market driven workforce development and education development for income eligible 16-24 year olds via its partnership with the Community College of Allegheny County and others through their Garfield YouthBuild program. Only time will tell if such measures can affect the level of disadvantage that so many low-income residents face. And typically, it takes far more than just a few local programs to curb the issues of generational poverty and violence. In that vein, citywide measures will have to compliment what community groups are already doing in neighborhoods like Garfield, if we are to see significant declines in poverty and gun violence. And policy makers must address these challenges through means that do not place vulnerable residents at risk for displacement.

IMG_1370
A Black bride walks up the stairs of a mirrored image of a spacious home off of Penn Avenue near the intersection of Penn and N. Graham Street.

Methodology Notes

All neighborhood level statistics were gathered via census tract level data from the 2012 to 2017 5-year American Community Survey estimates. Citywide statistics were gathered via the 2017 1-year ACS estimates. The 1990 poverty rate was gathered via poverty estimates from the National Historic Geographic Information Systems. The University of Pittsburgh Library System informed which census tracts comprised a given neighborhood in a given year. 2012 dollar amounts, incomes and values were adjusted for inflation using the consumer price index. Because Garfield consists of 3 census tracts, neighborhood level estimates were calculated via a weighted average based on census to neighborhood population proportions.

ACS estimates at the census tract level have sizeable margin or error and this may impact results.

Snippets of broader Pittsburgh history were not cited because they are common knowledge. “Student heavy centers” include all those census tracts within known student heavy locations and those neighborhoods that contain a 4-year college or university.

In neighborhood profiles and data briefs, neighborhoods and neighborhood areas are considered to have a simple racial majority when a given race constitutes 51% of the total population. Otherwise, it is considered a mixed-race neighborhood.

Poverty intervals were informed by standards in neighborhood-level poverty research. Specifically, researcher Patrick Sharkey’s poverty intervals were referenced from his book Stuck in Place – regarding what constitutes an extreme, high, moderate, low or very low poverty neighborhood.

Resident Interview: Knoxville

It took me two separate trips to complete my street by street walk of the racially mixed and high poverty South Hilltop neighborhood of Knoxville. In not making the greatest decision, I left my winter coat at home on a moderately temperate February day and regretted it almost immediately as the temperature began to dive. When I returned to complete my second walk of the neighborhood, I was prepared.

As mentioned in the Knoxville neighborhood profile, I have a close connection to the neighborhood. My mom grew up in the northern part of the Knoxville on Rochelle Street and my grandma lived there until she passed around 2007. I have an aunt and uncle who still live there and several cousins who I haven’t seen in at least a few years. Also, the very first rental apartment complex that I lived in with my parents and older sister is a block down the road from Knoxville in the northern-most part of Carrick.

IMG_1266
My grandma and mom’s old house on Rochelle Street in Knoxville. My aunt, uncle and cousins live in the white Row homes next door.

For my first walk of the neighborhood, I walked southward from the northern border of Knoxville at Cedarhurst Street. And so, for my second walk of the neighborhood, I decided to start walking from Knoxville’s southern border near St. John Vianney Cemetery, which is where my grandma and other extended family members rest. As I walked northward and zigzagged through some of the winding streets and alley ways of the southern part of Knoxville, I noticed just how White the southern part of the neighborhood is – as compared to the section of Knoxville north of Suncrest Street. Knoxville is one of only 7 neighborhoods and neighborhood areas in the City of Pittsburgh with no clear simple racial majority as of 2017 American Community Survey 5-year estimates. And yet, it is still fairly segregated; something my interviewee agreed with.

In a moment of serendipity, given my realization and the conversation that was about to take place, I ran into an amicable, honest and forward Black woman named Dana as I walked eastward on Suncrest Street. She possessed character traits that I deeply appreciate. I stopped, informed her of the project and she agreed to talk, as long as it didn’t take too long given the cold. While I attempted to talk to several neighborhood residents that cold afternoon, Dana was the only one who wasn’t in a rush to get somewhere and she didn’t mind spending a few extra minutes outside in the frigid weather.

Dana in Knoxville
Dana has lived in several South Hilltop neighborhoods over the past 20-years. She described what it’s like to be Black in Knoxville.

Dana told me that she was originally from Philadelphia and that she had been in Pittsburgh now for roughly 20-years.  Before living in Knoxville, Dana had rented in several other South Hilltop neighborhoods including Mt. Oliver, Beltzhoover and Allentown. I mentioned that my previous neighborhood profile had been on Manchester and she excitedly said that she had lived there too. Dana mentioned that she’s been in Pittsburgh for so long because of family. At one time, she had a full scholarship to Indiana University of Pennsylvania, but a set of unlucky circumstances kept her from going there. Around the time of receiving the scholarship, her dad went to jail, and she selflessly chose to stay behind and take care of one of her two sisters. She currently works in the service industry and has an affinity for good barbecue. She mentioned that I should check out the recently opened Fat Daddy’s just a few blocks down on Brownsville Road in Mount Oliver borough and I plan to.

When I asked her what her favorite part of living in Knoxville was she said, “Because it’s cheap.” Knoxville has the 5th lowest median home value in all of Pittsburgh and maintains rents that are comparatively cheaper than in demand locations on the City’s East End. For a brief time, Dana lived in Highland Park and said that she was paying upwards of $700 for a rental unit. Here in Knoxville, she was paying $400 something for the same type of unit. Her and her finance are saving up to buy a house, and Knoxville helps her save.

When I asked her about her least favorite part of Knoxville she immediately said, “Being brown and the cops. The shops on Brownsville Road don’t say “Whites only,” but as a Black person you come to understand which ones you’re welcome in and which one’s you aren’t. It’s tough being Black in Knoxville. And as a Black person you definitely avoid Carrick and you especially avoid Brentwood. And if you’re a Black person that lives in Carrick, well good luck to you.” She then asked, “Have you heard of Jonny Gammage?” And I replied, “No, I haven’t.” Dana went on to explain how Jonny was just visiting Pittsburgh back in the mid-90s and was killed by several police officers in the south suburban municipality of the very White and middle class Brentwood. All for getting stopped for his driving. When I looked up Jonny, I found a somewhat recent article in the Pittsburgh Post-Gazette that was published after a cop in the municipality of East Pittsburgh shot and killed an unarmed black teenager named Antwon Rose. According to the police officer, Antwon had “bolted” from a car during a traffic stop. He was only 17.

The article went on to say that Jonny had been “erratically” driving a borrowed car. Mr. Gammage was a mere 31 years old and died in the custody of the Brentwood police on route 51 in 1995. The cause of death was found to be asphyxiation, which was the result of the five police officers who tackled Jonny to the ground and held him there. Jonny was just visiting from Syracuse, NY. But to Dana, he was Black and in Brentwood. That’s the cost of being Black in the wrong place, and even in the “right” place. Three of the five officers were charged with involuntary manslaughter, but none were convicted. And in Pittsburgh the Black community arose in protest; much like they did after Antwon Rose was shot.

Dana passionately explained that she gets harassed by the police quite often in Knoxville. And even as I spoke with her at Suncrest Street and Roll way, not far from the McDonald’s on Brownsville Road, a few unmarked police vehicles and policemen had been patrolling the street for something or someone right before I started speaking with Dana. Dana mentioned a few occasions where she had been stopped by the police at night while walking home from her job in the service industry. “Sometimes after 12 hours or so on my feet I just want to smoke a cigarette on my walk back home. And I’ve been stopped just for walking and having a smoke,” said Dana. According to Dana, police officers would ask her invasive questions about what she was doing and why she was out so late, but she was just minding her own business and walking home from her job.

suncrest
Looking eastward on Suncrest Street.

Being Black in Knoxville is complicated. As described in Knoxville’s neighborhood profile, in 2018 alone, 3 young men were shot and killed in Knoxville, two of whom were Black males, and many more Black men, Women and even children were the victims of gun violence in just the past few years alone. And as reported by the Pittsburgh Courier, 75 of the 109 Homicides in 2018 in Allegheny County were Black. As researcher Patrick Sharkey’s recent book Uneasy Peace details, and in a brief write-up of the book by NPR, crime is at an all time low in many American cities. And poor urban neighborhoods are significantly less violent than they once were in the 70s and 80s. However, high poverty neighborhoods like Knoxville are still disproportionately affected by gun violence as compared to low poverty areas in Pittsburgh and beyond.

And so, as described by Dana, being Black in Knoxville means that you need to keep an eye out for the police. And that’s a shame, given that the other reality facing both White and Black Knoxville residents is their exposure to the neighborhood level measures of disadvantage that are highly predictive of gun violence and the gun violence itself. Sociological research into crime shows that violent crime is often a matter of economic circumstance, systemically high rates of male unemployment and single mother households, drug trafficking and its connection to a loss of real economic opportunity and a product and reaction to the high poverty neighborhoods in which many low-income Blacks are born into. Meaning, “Black on Black” gun violence is often a result of economic circumstance, severe lack of opportunity and is simply a matter of proximity given the reality of how racially segregated high and extreme poverty neighborhoods are. “Black on Black” gun violence is not some moral failing of the residents who reside in these neighborhoods.

As urban researchers Robert Sampson and William Julius Wilson have explained, local culture may play some role in gun violence, but local culture is a reaction to the severe constraints that face the residents of durably poor and disadvantaged neighborhoods. Being harassed or even killed for the color of your skin is a matter of circumstance that is beyond a person’s control. And being born into a poor neighborhood is also beyond a person’s control. And yet, young Black lives are lost to circumstances like these every day.

IMG_1272
View of the northern part of Knoxville from the vantage point of Knox Avenue and Brownsville Road. Dana and I were just a block or so away from this spot.

The Pittsburgh Neighborhood Project is deeply appreciative of Dana taking the time to stop and talk with me on such a cold winter day in Knoxville. Check out the full Knoxville Profile here. The views expressed in this article and all other articles of the Pittsburgh Neighborhood Project are mine alone and may not represent those of my current or former employers.

*If this is your first experience with the Pittsburgh Neighborhood Project, the Pittsburgh Neighborhood Project is a street by street exploration of all 90 neighborhoods in the City of Pittsburgh. As each neighborhood is walked they receive a neighborhood profile detailing past and recent neighborhood level indicators and analysis, photos and observations from my walks, a brief history of the neighborhood and resident interviews like this one. The secondary goal of the project is to expose the high degree of racial and economic segregation by neighborhood in Pittsburgh and lasting neighborhood poverty. Data briefs address this secondary goal and are comprehensive statistical, geospatial and research driven analyses and extrapolations. Please check out the Pittsburgh Neighborhood Project to see what I’ve analyzed and written about thus far.*

Neighborhood Profile: Knoxville

Once a thriving neighborhood home to middle managers of the Steel Mills that resided down below on the Monongahela river valley, the South Hilltop neighborhood of Knoxville is a topographically diverse area with a collection of flat streets and hilly avenues with modest slopes. The neighborhood is densely populated by brick single family homes and subdivided rentals. And no, I’m not talking about Knoxville, Tennessee; something I have to correct all too often when I speak of Knoxville to other longtime Pittsburghers (who did not grow up south of the Monongahela river). Anecdotally speaking, Knoxville is one of the many struggling Pittsburgh neighborhoods that seem to escape the attention and awareness of those Pittsburghers who don’t know the south end of the city beyond the South Side Flats. The neighborhood is bordered to the north by Cedarhurst Street, to the west by Beltzhoover Avenue and Tarragonna Street, to the east by Amanda Avenue and Brownsville Road and to the south by St. John Vianney Cemetery (the place where my grandma and cousins rest). The neighborhoods of Allentown, Beltzhoover, Bon Air, Carrick and Mt. Oliver Borough (the only suburb completely surrounded by city neighborhoods) are north, northwest, southwest, south and east of Knoxville, respectively. When atop some of Knoxville’s steeper slopes, the northern part of the neighborhood is in full view with the U.S Steel building towering over the horizon. Truly, Knoxville is a complicated place, but one that has always felt like home to me (and a neighborhood that I adore).

Knoxville

Knoxville is located in Pittsburgh’s South Hilltop region. 

IMG_1272
The dense neighborhood of Knoxville from the vantage point of Knox Avenue and Brownsville Road. The U.S Steel building towers in the distance.

The neighborhood of Knoxville was named after the fruit farmer Jeremiah Knox who settled there in the early 1800s and was known for his strawberries. The neighborhood was once home to Shade trees that lined the streets. Several streets were named after Knox’s extended family and others were named after the literal fruits of his labor: such as Rochelle Street, Amanda Avenue and Charles Street, and Jucunda Street and Orchard Place, respectively. The neighborhood was a desirable site for farming because of two topographical shelfs that blocked out the smoke and smut from the Steel Mill below in what is now known as the South Side Flats, and shut out smoke from other mills lining the Monongahela river. The first shelf is a feature of Allentown and the South Side Slopes and the second is a topographical slope down from Cedarhurst Street. As the neighborhood became more accessible via the Mt. Oliver incline in the 1870s and via the Knoxville and St. Clair Electric railroad in 1888, the population began to increase and drove dense residential development. Managers of the South Side steel mills preferred Knoxville because of its low level of pollution and easy access to the South Side Flats. The neighborhood was annexed by the City of Pittsburgh in 1927.

Knoxville is 1 of only 7 neighborhoods and neighborhood areas in the City of Pittsburgh with no clear simple racial majority. The neighborhood is roughly 46% black, 40% white, 6% Asian, 6% biracial and 2% Hispanic or Latino – per 2017 5-year American Community Survey estimates. And it’s important to state that this racial mixing wasn’t by design. Like many other neighborhoods and suburban boroughs along the Monongahela river valley, Knoxville began to steeply decline in population as the Steel Mills shuttered and closed in the late 70s and early 80s. Even before the decline of the mills, neighborhoods like Knoxville were subject to the same sort of depopulation trends happening throughout the city as a whole from the 1950s onward – due to increasing suburbanization and White flight. And as the population continued to decline decade after decade, neighborhood churches, schools, local institutions and businesses on the Knoxville side of Brownsville Road closed as well. While there are no longer any secondary schools that are currently open in the neighborhood, the teenagers of Knoxville feed into Carrick High School – much like my mom did when she was young.

IMG_1256
Town style row homes in northern Knoxville.

The neighborhood is a microcosm of the consequences of de-industrialization and depopulation across the U.S. As those who were able/willing to leave the neighborhood did, the poverty rate began to steadily rise. Only those families who were left behind remained, along with those families who intended to whether the change. Racial mixing did not so much occur via some package of intentional integration policies, but instead as the result of the demolition of Public Housing projects throughout the City of Pittsburgh (such as the former St. Clair Village in the 2000s) and by way of Knoxville remaining transit accessible and having cheaper rents (comparatively) than economically similar neighborhoods in more opportunity rich parts of Pittsburgh.

Despite my existing knowledge of the neighborhood from my spending time there as a child and teenager, my street by street walk of the neighborhood revealed just how racially divided the neighborhood is; something I had never quite realized when I was younger. South Knoxville appeared to be home to many White residents. I even spotted some “Don’t Tread on Me” flags dotted throughout the southern tip of the neighborhood; a reminder of the more conservative political tendencies of working-class White residents throughout the Hilltop and south Pittsburgh – despite their economic status and position. This feature was true of my own home growing up in Brookline, although as one that was quite poor. And obviously, not all working class White residents fall into this political category. As I walked north of Suncrest Street, the residents walking the neighborhood were increasingly Black. And despite notable exceptions of integrated groups of White and Black residents in the neighborhood, some of the Black residents I spoke to on my walk reinforced the notion of how different it is to be Black in Knoxville. Their resident interview can be read here. 

IMG_1284
Sturdy brick single family homes in South Knoxville.

Remnants of the once tree-lined streets are still present in south Knoxville and the housing stock is sturdy and compact. Much like my walk throughout Manchester, while dilapidated housing was littered throughout the entire neighborhood, its concentration tended to increase as I walked northward – especially so north of Bausman Street. A number of vacant lots broke open the otherwise dense housing landscape. But beautiful housing is present throughout the whole of the neighborhood and I have my own affinity towards my mom and Grandma’s old home on Rochelle street in the northern part of Knoxville. Wide open vistas of the neighborhood can be viewed at the top of the certain alley ways and steeples of closed churches still permeate the neighborhood; including the now closed St. Canice on Orchard Place – which was the place where my sisters and I were baptized into the Catholic Church. While a small number of bars and convenience stores reside on the Knoxville side of Brownsville Road, a number of former businesses are vacant. Aprimo Pizza, Napa Auto Parts, McDonald’s and the remodeled Carnegie Library of Pittsburgh also call the Brownsville Road business corridor home. While not in Knoxville, the bars, stores and convenience shops of Mount Oliver Borough are nearby.

IMG_1280
Tree-lined streets in South Knoxville

IMG_1262
An elderly Black man smokes a cigarette and leans next to a building that is adjacent to vacant lots on all sides. The vacant lots sit north of Bausman Street and Knox Avenue.

Unlike the small portion of formerly disadvantaged and poverty-stricken Pittsburgh neighborhoods that are rapidly emerging in rent and home value and declining in poverty and other measures of disadvantage, Knoxville is like most other high and extreme poverty neighborhoods in that it has gained in poverty overall and has remained durably poor for decades. While Knoxville’s estimated poverty rate has fluctuated over the years, the rate of individuals living below the federal poverty line increased by 11 percentage points from 1990 to 2017 (19% to 30%) and the poverty rate has generally stayed upwards of 30% in recent years. High poverty Knoxville has also continued to see its population decline with a loss of 968 residents from 2012 to 2017 – with an estimated population of 4,333 in 2012 and of 3,365 in 2017. Like is found in most Pittsburgh neighborhoods that will also be profiled, steep racial divides exist between the Black and White population regarding median income and poverty rate – even in such a high poverty setting. While both the White poverty rate and Black poverty rate saw declines from 2012 to 2017 (a decline of 7.9% and 5.6%, respectively), the Black poverty rate is still 5.4 times that of the White Poverty Rate (43% for Black people and 7.9% for White as of 2017). And while the White household median income has increased from an estimated $43,757 to $45,794.00 over the 5-year period, the Black household median income has declined by a percentage change of 34% (from $27,972 to $18,537 or a difference of nearly $9,500). The White population also grew by 4% and the Black population declined by 9% over this time – with a 4% increase in the multiracial population.

Knoxville estimated measures of need and value are mixed regarding gains and declines from 2012 to 2017. Regarding measures of value, median gross rent and median home value have declined in the past 5-years (from $861 to $792 and from $46,635 to $44,300, respectively). Indicators of need such as those living below the FPL have decreased by 7% (down from 37%), single mothers with children has decreased by 14% (down from 37%), and those 25 and above with at least a bachelor’s degree or more have decreased by 4% (from 91% to 87%). However, while these declines in need may symbolize more significant change, they must be put in context. As of 2017 ACS estimates, and among all other Pittsburgh neighborhoods and neighborhood areas, Knoxville had the 8th highest rate of single mothers with children, the 7th highest rate of males who are unemployed or unattached from the labor force (when removing college student heavy neighborhoods from the rankings), the 12th highest rate of those 25 and up without a Bachelor’s degree or more, the 11th lowest median Black household income (when removing college student heavy neighborhoods from the rankings) and the 5th lowest median home value in all of Pittsburgh. And so, despite these declines in need, need levels are still quite high in both real terms and comparatively. These high measures of need come with a heavy cost on the community for such factors have contributed to the relatively high rate of gun violence found in durably poor neighborhoods like Knoxville.

IMG_1268
Unique single family architecture on Zara Street that has seen better days, but evokes a timeless sense of charm.

In 2018 alone, 3 young men lost their lives to gun violence in Knoxville: James Loughlin (a 23-year-old white male), Tamon Hatchin (a 24-year-old Black Male) and Anthony Bullock-Fields (a 29-year-old Black male). And on Friday, February 8th 2019, a home invasion resulted in the hospitalization of a suspect and home resident due to gun fire exchange. And sadly, gun violence has been present in Knoxville for years. In 2014, 36-year-olds Jason Eubanks and Cheralynn Sabatasso were shot and killed. In 2015, 15-year-old Curtis pounds was a 9th grader at Carrick High School who was shot and killed. Curtis’s Aunt said that Pound’s father had been shot and killed 6 years ago and that her sister had also been murdered in 1993. In 2015, Police Officers shot and killed a fugitive charged with rape of a young child, assault and other crimes. According to police, the man had held what turned out to be an all-black air gun “in a manner consistent with what one would see when trained to use a handgun against officers.” In 2016, a 6-year-old Black girl named Isis Allen was tragically shot in the head by stray bullets in the summer of that year. 23-year-old Black female Shanique Sanders was shot down and found dead on McKinley Street in November of 2016. In March of 2017, a murder/suicide occurred when 46-year-old Christopher Dancy was shot and killed by 47-year-old Joseph Goldsmith before turning the gun on himself. A 9-month year old infant was injured from glass due to an exchange of fire between two men in April of 2017. In November 2017, 52-year-old Black woman Regina Beck Jordan was found shot in the head in her dining room on Rochelle Street and hospitalized. In July 2018, a man was shot at the intersection of Bausman and Brownsville Road and was taken to the hospital in stable condition. And in November of 2018, an 18-year-old man was taken to the hospital in critical condition after multiple wounds to the abdomen. This is not an exhaustive list, but a large snippet of gun violence that has occurred in Knoxville over the past few years. In being brutally honest, I cried when I read this list aloud to my younger brother – because so many of these young men and women were taken due to circumstance.

To be quite explicit, social science research shows that community level measures of concentrated poverty, percentage of men unemployed or unattached to the labor force, percentage of single mothers with children, drug trafficking and its connection to gun violence and other structural variables of disadvantage all have a hand in creating the conditions and opportunities for gun violence to disproportionately occur in high poverty areas like Knoxville. Meaning, gun violence is often a matter of economic circumstance and disadvantage, and is not some moral or cultural failing of the people who reside in durably poor communities. And often, it is carried out by a small percentage of the younger population who cause a disproportionate amount of the violent crime. And regarding the high degree of gun violence in majority Black neighborhoods (along with the fact that 69% of all victims of homicide in 2018 were Black – despite the fact that Black people make up only 13% of Allegheny County’s population), urban researchers argue that the high degree of gun violence in impoverished Black and mixed race communities is a matter of proximity and multigenerational exposure to highly disadvantaged neighborhoods. Meaning, because majority Black neighborhoods in Pittsburgh (and else where) tend to be so durably high poverty and segregated, young Black people are much more exposed and at risk to gun violence as compared to White people because of the neighborhoods and economic circumstances that they were born into. The exception of Knoxville is that it is a racially mixed neighborhood – albeit one that is still segregated. As such, both White and Black residents are exposed to both the economic and systemic conditions that cause the gun violence and the gun violence itself. Meaning, high gun violence is not an issue of race, but of the factors that create it – as described. However, the factors that create it have often been historically and systemically tied to areas of Black concentrated poverty.

The neighborhood conditions that tend to predict violence are the result of systemic and macroeconomic forces and self-reinforcing patterns of multigenerational exposure to concentrated poverty and disadvantage. Researchers Robert Sampson and Patrick Sharkey have analyzed and written on these topics extensively (see Chicago and the Enduring Neighborhood Effect and Stuck in Place). As discussed in a previous data brief, Black people are far more likely to reside in areas of concentrated poverty in Pittsburgh than White people are. As found in the analysis, an overwhelming 76% of majority Black neighborhoods are considered high or extreme poverty as of 2017 ACS estimates – compared to a mere 6% of majority White neighborhoods that are considered high or extreme poverty (with poverty rates exceeding 30% to 40% or more).

IMG_1260
A set of green and white homes on Grimes Avenue in northern Knoxville.

In one of the most cited papers of the past few decades regarding the structural causes of violent crime in racially and economically segregated neighborhoods, renowned researchers William Julius Wilson and Robert Sampson of Harvard argued that the rate of unemployed or unattached males to the labor force and concentrated poverty tend to disrupt families and affect the rate of single mother households with children. In turn, it has been found that high rates of single mothers with children is a leading predictor of violent crime – especially so among juveniles. More recent research from Sampson shows how higher rates of incarceration among Black men have also disrupted the family and led to an increase in single female houses with children. Regarding higher rates of incarceration, Sampson found that the rates of incarceration among Black men in Chicago neighborhoods for committing the same crimes as White men is a different of kind, not degree. While both researchers don’t ignore the fact that neighborhood culture may play some role in violence, they argue that cultural primers of violence are a response to the overwhelming disadvantage of many racially and economically segregated neighborhoods and the lack of living wage job opportunities for residents. Now, violent crime is complex, but my point is that structural variables at the neighborhood level tend to be quite predictive of crime. And as discussed, Knoxville has some of the highest rates of single mothers with children and men who are unemployed or unattached to the labor force in the City of Pittsburgh.

IMG_1250
Saint Canice is visible in the distance on Orchard Place – which is located in the most northern section of the neighborhood.

Knoxville, like many other durably poor neighborhoods in Pittsburgh, is a complicated place. While it is measurably disadvantaged as compared to low poverty neighborhoods in Pittsburgh, it is also home to residents who deeply care about their neighborhood and are doing their best to get by. And many are resilient, friendly, knowledgeable and charismatic – per my own personal experiences with family and friends in Knoxville and per my street by street walk of the neighborhood. Although not by design, Knoxville is one of the most racially diverse neighborhoods in the entire city, but it is still segregated when comparing the southern and northern sections of the neighborhood. Knoxville has access to transit via the 51, 44 and 54, but there is only one grocery store in the entire South Hilltop. Knoxville has sturdy, compact and wonderfully charming homes, but a high degree of vacancy and blight. Knoxville is the place where my mom and most of my mom’s side of the family grew up. And my grandma’s house holds a special place in my memory; whether the memory be of her neighborhood famous rigatonis or the times when my great-uncle would chase me around her house with a buzz cutter because my hair was “way too damn long.” I once received some sage advice from my Great Uncle Bill. Uncle Bill also resided with my grandma in the house with the Japanese Apple Tree out front and the dark green porch swing that my siblings and I would play on when we were younger. He told me that a boy who never ended up in the hospital from doing something reckless with his friends would never really have that great of a childhood (and my best friend and I took his advice a bit too seriously growing up).

Knoxville is home to beautiful vistas and a visibly tight social network but is plagued by community violence that is preventable. Knoxville is struggling, as are many of its most vulnerable residents, but its story doesn’t have to end that way – nor should it. While Knoxville is one of many high poverty neighborhoods that has not seen the benefit of Pittsburgh’s so-called renaissance and revitalization, there are strategies out there that aim to invest in the people of disadvantaged places and provide them with real opportunity. And there are already local non profits that deeply care about the social mobility and health of those residing in the Hilltop (such as the Brashear Association and the Hilltop Community Children’s Center). Pittsburgh’s economic growth alone will not solve the problems of durable poverty and cemented disadvantage in places like Knoxville. Intentional place-based and people centered policies, investments and strategies are needed to combat the barriers that residents have faced for generations.

IMG_1266
My mom and grandma’s former house is featured on the right side of the photo. A Japanese Maple Tree sits in the front yard. A seedling from that same tree became a Japanese Maple Tree in my parent’s front yard in Brookline. My uncle and cousins reside in the white row houses.

Methodology Notes

All neighborhood level statistics were gathered via census tract level data from the 2012 to 2017 5-year American Community Survey estimates. Citywide statistics were gathered via the 2017 1-year ACS estimates. The 1990 poverty rate was gathered via poverty estimates from the National Historic Geographic Information Systems. The University of Pittsburgh Library System informed which census tracts comprised a given neighborhood in a given year. 2012 dollar amounts, incomes and values were adjusted for inflation using the consumer price index.

ACS estimates at the census tract level have sizeable margin or error and this may impact results.

Snippets of broader Pittsburgh history were not cited because they are common knowledge.

In neighborhood profiles and data briefs, neighborhoods and neighborhood areas are considered to have a simple racial majority when a given race constitutes 51% of the total population. Otherwise, it is considered a mixed-race neighborhood.

Poverty intervals were informed by standards in neighborhood-level poverty research. Specifically, researcher Patrick Sharkey’s poverty intervals were referenced from his book Stuck in Place – regarding what constitutes an extreme, high, moderate, low or very low poverty neighborhood.

Residential Segregation by Race and Income in Pittsburgh Neighborhoods: A Data Brief

Before we start taking an intimate look at each Pittsburgh neighborhood as this project evolves, I wanted to share some evidence regarding the other goal of this project as a whole; exploring the reality of lasting, cemented and durable concentrated poverty in Pittsburgh neighborhoods and the city’s high degree of residential segregation by race and income.

At a glance, the City of Pittsburgh is estimated to have a total population of about 302,414. Pittsburgh is a largely White city (65%) with the second largest racial group being Black people (22%). The other notable racial groups are Asian (6%) and Hispanic or Latino (roughly 3%) – with multiracial residents and very small numbers of other minority racial groups taking up the small remainder. When excluding neighborhoods in the East End that are in close proximity to the city’s universities (and have heavy concentrations of college students), Pittsburgh’s small and native Hispanic or Latino population is highly concentrated in neighborhoods like Mount Oliver Neighborhood, Crawford-Roberts, the Beltzhoover/Bon Air area and Mount Washington (in that order by percentage) and in Beechview, Greenfield, Brookline and Mount Washington (in that order by total number). Much like the Latino or Hispanic population, the Asian population is almost entirely concentrated in neighborhoods around Pittsburgh’s universities in the East End when those neighborhoods aren’t excluded – with the highest percentage concentrations in North Oakland, Shadyside, Friendship, Squirrel Hill South and Squirrel Hill North. As such, it is likely that Asian residents in these neighborhoods are largely students or graduate transplants – as is likely with the Latino or Hispanic population. The exception is a growing population of southeast Asian refugees and immigrants settling in neighborhoods like Carrick, Brookline, Banksville and the Ridgemont and Westwood area (in that order by total number) and in Banksville, the Ridgemont and Westwood area, Knoxville and the Strip District (in that order by percentage). Other than these minority racial variations, the city’s neighborhoods are largely dominated by White and Black hues. While about 1 and 5 Pittsburghers fell below the Federal Poverty Line (FPL) in 2017, roughly 13% of White individuals in Pittsburgh did and 35% of Black Pittsburghers did – despite the fact that Black people makeup only 22% of the overall population (American Community Survey or ACS 1-Year Estimates for the year 2017).

Nearly mirroring city-wide racial demographics, 68% of Pittsburgh’s neighborhoods and neighborhood areas are majority White and 23% are majority Black – with a total of 17 majority Black neighborhoods and a total of 50 majority White neighborhoods and neighborhood areas. Populations that are either 51% Black or White at the neighborhood level constitute a simple racial majority in this analysis. The remaining neighborhoods and neighborhood areas are racially mixed neighborhoods with no clear majority (9% of neighborhoods and only 7 total). As such, truly racially mixed neighborhoods are rare in Pittsburgh. And as will be discussed in future neighborhood profiles, there is little evidence that these racially mixed neighborhoods with no clear simple racial majority were integrated by intentional design. The high poverty Knoxville is one such racially mixed neighborhood with a Black population of 46% and a White population of 40% – with the remainder composed of mixed races and other minority racial groups. The collapse of the Steel Industry, relatively cheap rental units, and the displacement of Black families from the St. Clair Village Public Housing project in the 2000s may account for such a mixing in neighborhoods such as Knoxville. Those residents with means to do so often chose to leave the Knoxville neighborhood as it began to decline, according to some residents I spoke with. There’s a saying that Steelers’ fans “travel well” – given their spread throughout the U.S. However, after the collapse of the steel mills and the effect such a collapse had on the entire regional economy, many of these Steelers’ fans left for economic opportunity else where. Much like racial separation, Pittsburgh neighborhoods are highly divided by the percent of their respective populations below the Federal Poverty Line. 24% of Pittsburgh neighborhoods are high or extreme poverty, 22% are moderate poverty and the remainder are low or very low poverty (54%). And all too often, racial and economic segregation are not mutually exclusive in Pittsburgh neighborhoods. In fact, they are overwhelmingly tied together (ACS 5-Year Estimates for the year 2017).

Census tracts by Adjusted Poverty (lower cases)
While neighborhoods and neighborhood areas were used in the poverty and racial analysis, this map showcases defined poverty intervals by census tract. Poverty rates were adjusted for tracts that fell within neighborhood boundaries that contained a college or university or those neighborhoods that are known student heavy areas. Such areas are: Downtown, the Bluff, the Oakland neighborhoods, Squirrel Hill North and South, Southside Flats and Shadyside.

Even though Black people make up only 22% of Pittsburgh’s population, an overwhelming 76% of majority Black neighborhoods are high or extreme poverty – with high poverty defined as neighborhoods with overall poverty rates ranging from 30% to 39% and extreme poverty defined as those with at least 40% or more. And often, poverty percentages in majority Black neighborhoods considered high or extreme were far above these research-defined thresholds – with a range of 30% to 74% of individuals living below the FPL. Six percent of majority Black neighborhoods are moderate poverty and the remaining majority Black neighborhoods are low poverty (18%). As in, only 3 majority Black neighborhoods are considered low poverty: East Liberty, Manchester and the Upper Hill – which all had poverty rates between 10% and 19%. Virtually no majority Black neighborhoods are considered very low poverty – defined as those neighborhoods with poverty rates less than 10%. On the other side of the racial spectrum, White neighborhoods fair very differently regarding poverty makeup. Only 6% of majority White Neighborhoods are high poverty and none are considered extreme poverty. As such, there were only 3 high poverty areas that were majority White: the Bluff, the neighborhood area of Hays, Hazelwood and Glen Hazel – which all share a census tract(s) as of the 2010 census – and the upper Northside hilltop neighborhood of Spring Hill-City View. 26% of majority White neighborhoods were considered moderate poverty with poverty rates between 20% and 29% and the overwhelming remainder were either low or very low poverty (68%) (ACS 5-Year Estimates for the year 2017).

As presented, race and class are often closely tied together at the neighborhood level in Pittsburgh. And this phenomenon is true of cities across the nation (see researcher Robert Samson’s Chicago and the Enduring Neighborhood Effect). However, Pittsburgh’s unique topographical features, its “bus in-to-town and bus out-of-town” port authority system and its highway and busway structures make said divide even more pronounced and isolating. Of those extreme poverty neighborhoods, 0% were white and 88% were black. The only neighborhood area that was also extreme poverty and not majority Black was the racially mixed Terrace Village and West Oakland area – with each neighborhood sharing a census tract as of the most recent census. However, the bulk of the neighborhood area’s poverty comes from the largely Black Terrace Village. And so, if this neighborhood area is removed from the mix, 100% of extreme poverty neighborhoods are majority Black.

Northview Heights is a strong example of a neighborhood that is geographically isolated with limited port authority access – as compared to many neighborhoods in the city’s East End – and has a staggering 74% poverty rate. The population is not just majority Black, but overwhelmingly black (91%). And only 2% of its population is White. In fact, 54% of majority White neighborhoods are overwhelmingly White – as are 53% of black ones; meaning that in these cases at least 75% of a neighborhood’s population is a given racial group rather than just a simple racial majority of 51%. Of those neighborhoods considered high poverty, 30% are White and 60% are Black – with the remaining percentage coming from the racially mixed Knoxville. As such, only a small portion of White residents live in high or extreme poverty neighborhoods. Such White residents exist along with smaller makeups of racially mixed residents and Asian and Latino refugees and immigrants. However, the majority of White neighborhoods are low or very low poverty. The subject of White versus Black poverty for a given neighborhood or neighborhood area will be a feature of the neighborhood profiles.

Lastly, neighborhood poverty level does not tend to change over time for the majority of Pittsburgh neighborhoods. As can be seen in the figure below, there is a strong linear relationship between neighborhood poverty rate in 1990 and neighborhood poverty rate in 2017 (R=.82 with alpha set at less than .01). And neighborhood poverty rate in 1990 explains 67% of the variance around the mean regarding neighborhood poverty rate in 2017. To get around the science speak, this means that despite broad macro-economic changes at the national level and economic changes and growth at the city level over a period of 27 years, low poverty neighborhoods tend to remain low poverty, moderate poverty neighborhoods tend to remain moderate or get poorer and high poverty neighborhoods tend to remain high poverty or get poorer.

durablity

There are a few neighborhoods that have seen steep declines in poverty rate from 1990 to 2017, but most neighborhoods have remained stable. Neighborhood areas like Arlington and Arlington Heights (a 19% decline) and neighborhoods like Terrace Village (a 13% decline) most likely saw steep declines because of the removal of a substantial portion of public housing by the city from the 1990s and on through the 2000s. St. Clair Village is one example of a neighborhood that was once a public housing project and is now being developed as an Urban Farm; it was no longer assigned its own census tract due to having little to no population as of more recent ACS surveys. Neighborhoods like Manchester (22% decline), the East Allegheny and North Shore area (12% decline) and the Strip District (12% decline) may have seen steep declines due to intentional public and private investment and development – along with historic preservation efforts and an influx of higher income residents. Neighborhoods with a large share of low-income renters and limited affordable housing supply are often the most at risk regarding involuntary displacement due to intentional investment and the subsequent residential demand (and rise in rents), but most poor neighborhoods have not been the target of such investment. And often, low and fixed-income tenants face the possibility of eviction no matter where they live. Meaning, involuntary displacement is not just a possible consequence of neighborhood change and revitalization, but rather a reality for most low or fixed-income residents in even Pittsburgh’s poorest neighborhoods; neighborhoods that haven’t substantially changed for decades.

As will be discussed in future posts, such a degree of racial separation is not merely due to self-preference or selection alone. Instead, and broadly speaking, such division exists because of historical and present discrimination in housing and lending markets, urban renewal, major changes in the labor market from the 1980s onward and subsequent economic restructuring and major demographic changes and out-migration from the 1950s to the 1980s (see researcher William Julius Wilson’s the Truly Disadvantaged, Rothstein’s the Color of Law and a Coates’ the Case for Reparations to get a detailed account of these processes). And as will also be discussed in future posts, research shows that childhood development in high poverty areas is tied to a number of negative outcomes in adulthood and is strongly tied to generational poverty. And experimental research show that low-income children who primarily grow up in low poverty neighborhoods before the age of 12 have positive outcomes as compared to their peers who remain in high poverty ones (see researcher Raj Chetty’s work with the Moving to Opportunity experiment). Patrick Sharkey’s Stuck in Place also explores the effect of cumulative concentrated disadvantage on childhood development and respective adult outcomes over multiple generations (and Vox did a great write-up of Sharkey’s research here). And so, neighborhoods tend to stay the same without intentional intervention. Neighborhoods effect and shape our lives, behaviors and opportunities in a significant way. As such, it is quite troubling that such a large portion of Pittsburgh’s Black population is often living in isolated areas of lasting concentrated poverty and disadvantage. This fact will become more evident as the project continues on with resident interviews and Neighborhood Profiles.

Methodology Notes:

The analysis of Pittsburgh neighborhoods and neighborhood areas used American Community Survey (ACS) 5-Year Estimates for the year 2017 – as collected from the U.S Census. 2017 estimates are the most recent year regarding published data from the ACS. Citywide data came from 2017 ACS 1-year estimates. Because the census tracts that makeup Pittsburgh neighborhoods have changed over time the University of Pittsburgh Library System was referenced to inform which census tracts comprised a given neighborhood in both 1990 and 2017. As of the 2010 census, a number of neighborhoods shared the same census tract. In these cases, neighborhoods were combined. Neighborhoods that were combined with another neighborhood were referred to as neighborhood areas. Any time that a neighborhood was comprised of more than one census tract or was combined due to sharing a census tract(s) with another neighborhood a weighted average was used to construct neighborhoods. Weights were based on census tract population proportions.

Regarding the total population of neighborhoods and neighborhood areas used, the Chateau, St. Clair and South Shore neighborhoods were not included in the analysis because they had populations of less than 100. Neighborhoods with student heavy residential populations and neighborhoods that contained a 4-year university were included but their poverty rates were adjusted by using estimates for those ages 25 and up who were below the FPL – as to control for student heavy populations. Because the average college student is unemployed or working a minimum wage job, student heavy centers dramatically skew the real poverty rate. This is not to say that the analysis ignores the reality of low-income college students. Rather, neighborhood poverty rates were adjusted because of the difficulty in accessing the true poverty rate. In total, 74 neighborhoods and neighborhood areas (those neighborhoods that share a census tract(s) with another neighborhood) were used in the analysis. For the durability of poverty analysis from 1990 to 2017 data from the National Historic Geographic Systems was utilized to collect census level poverty estimates for the year 1990. Poverty rates were not adjusted to control for student populations in the durability of poverty regression analysis because the purpose of the analysis was to show how little poverty rate changes over time in most Pittsburgh neighborhoods; and student inflated poverty rates in 1990 are very much comparable to student inflated poverty rates in 2017.

As should be noted, ACS estimates are notorious for wide margins or error (MOE) due to smaller than optimal sample sizes. As such, MOE may impact results. That being said, the degree to which Pittsburgh neighborhoods are segregated by race and income appears to have an impact on the accuracy of estimates – despite high MOE. Meaning, because neighborhoods are often so overwhelmingly comprised of residents with similar socio-economic and racial demographics, smaller sample sizes are often more representative than they should be. As such, ACS estimates should not be disregarded because of high MOE. Rather, they should be taken with a grain of salt and checked against the working knowledge of those with professional and personal experience in a given neighborhood.

And on this note, while durability of poverty tends to be the trend in Pittsburgh neighborhoods, there are several neighborhoods that have been emerging at a steep pace regarding housing demand and subsequent rental prices. As such, 2017 estimates may not accurately portray current racial and poverty measures for the year 2019 in neighborhoods like Lower and Central Lawrenceville, East Liberty and the western portion of East Allegheny (commonly known as Deutschtown). Fixed-income and low-income renters, and even low-income home owners, are at risk of involuntary displacement without affordable housing and property tax protections, respectively.

I’d be happy to send info on which data tables I used from the census for those interested. Thanks for reading and please feel free to share or use the data as long as you cite this page as the source.